Fig. 3.
Download original image
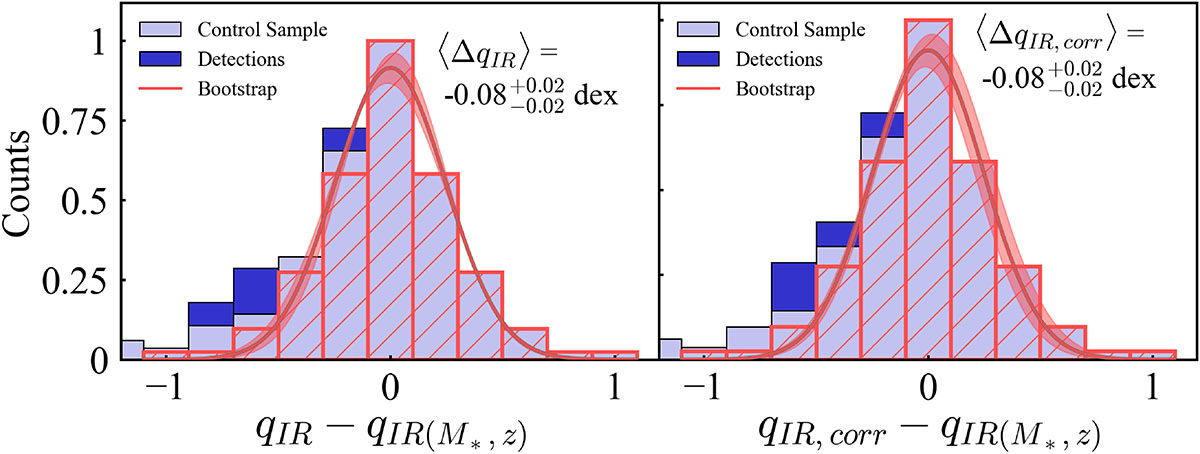
Normalized distributions of difference between the observed qIR and the one expected from Eq. (4) (Delvecchio et al. 2021) based on the stellar mass and the redshift of the host galaxy, qIR (M★, z). The light purple histogram represents the distribution of the (M★, z)-CS. The stacked dark purple histogram (i.e., dark purple histogram on top of the light purple one) represents the detections, and the hatched orange histogram is the so-called mirror distribution, interpreted as the intrinsic qIR distribution of SFGs. The bootstrapped median values of the mirror distribution were fit with a Gaussian (red curve; see Sect. 5 for further details). Left panel: qIR was computed using the VLA luminosity coming from both star formation and AGN activity. Right panel: qIR, corr is measured after subtracting the AGN radio luminosity detected by the VLBA from the total radio VLA emission.
Current usage metrics show cumulative count of Article Views (full-text article views including HTML views, PDF and ePub downloads, according to the available data) and Abstracts Views on Vision4Press platform.
Data correspond to usage on the plateform after 2015. The current usage metrics is available 48-96 hours after online publication and is updated daily on week days.
Initial download of the metrics may take a while.