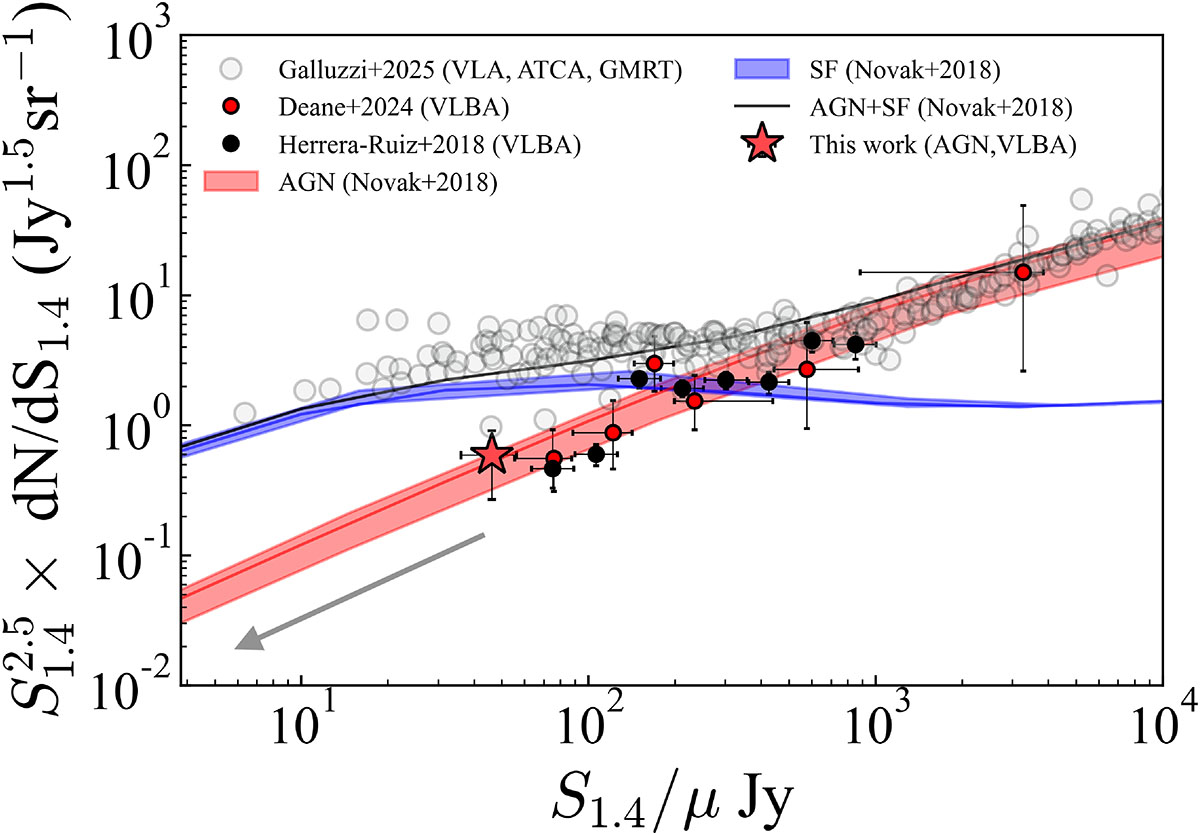
Fig. 4.
Download original image
Euclidean normalized radio-source number counts obtained by fitting with the Markov chain Monte Carlo algorithm, and the total radio luminosity function (LF) from Novak et al. (2018) using different evolving analytical LFs for AGN hosts (red line) and SF galaxies (blue line). The shaded areas encompass the 3σ errors from the χ2 fits performed on individual populations (for further details, see Novak et al. 2018). Gray circles are the number counts from Galluzzi et al. (2025) obtained from a compilation of radio observations with different instruments (e.g., VLA 1−3 GHz, ATCA, GMRT, LOFAR, MeerKAT, etc.), without any distinction between AGNs or SF. Red and black circles show the number counts from the VLBA CANDELS GOODS-North Survey (Deane et al. 2024) and VLBA 1.4 GHz COSMOS (Herrera-Ruiz et al. 2018) in the case of radio emission from AGN activity. The red star is the number count of the detections from the AGN-sCAN survey presented in this work. The gray arrow points toward the regime below our sensitivity limit, from which the number counts extrapolated from the red curve of Novak et al. (2018) of the 42 brightest AGN were extracted, in order to constrain upper limits on our results (see text in Sect. 7.1 for further details).
Current usage metrics show cumulative count of Article Views (full-text article views including HTML views, PDF and ePub downloads, according to the available data) and Abstracts Views on Vision4Press platform.
Data correspond to usage on the plateform after 2015. The current usage metrics is available 48-96 hours after online publication and is updated daily on week days.
Initial download of the metrics may take a while.