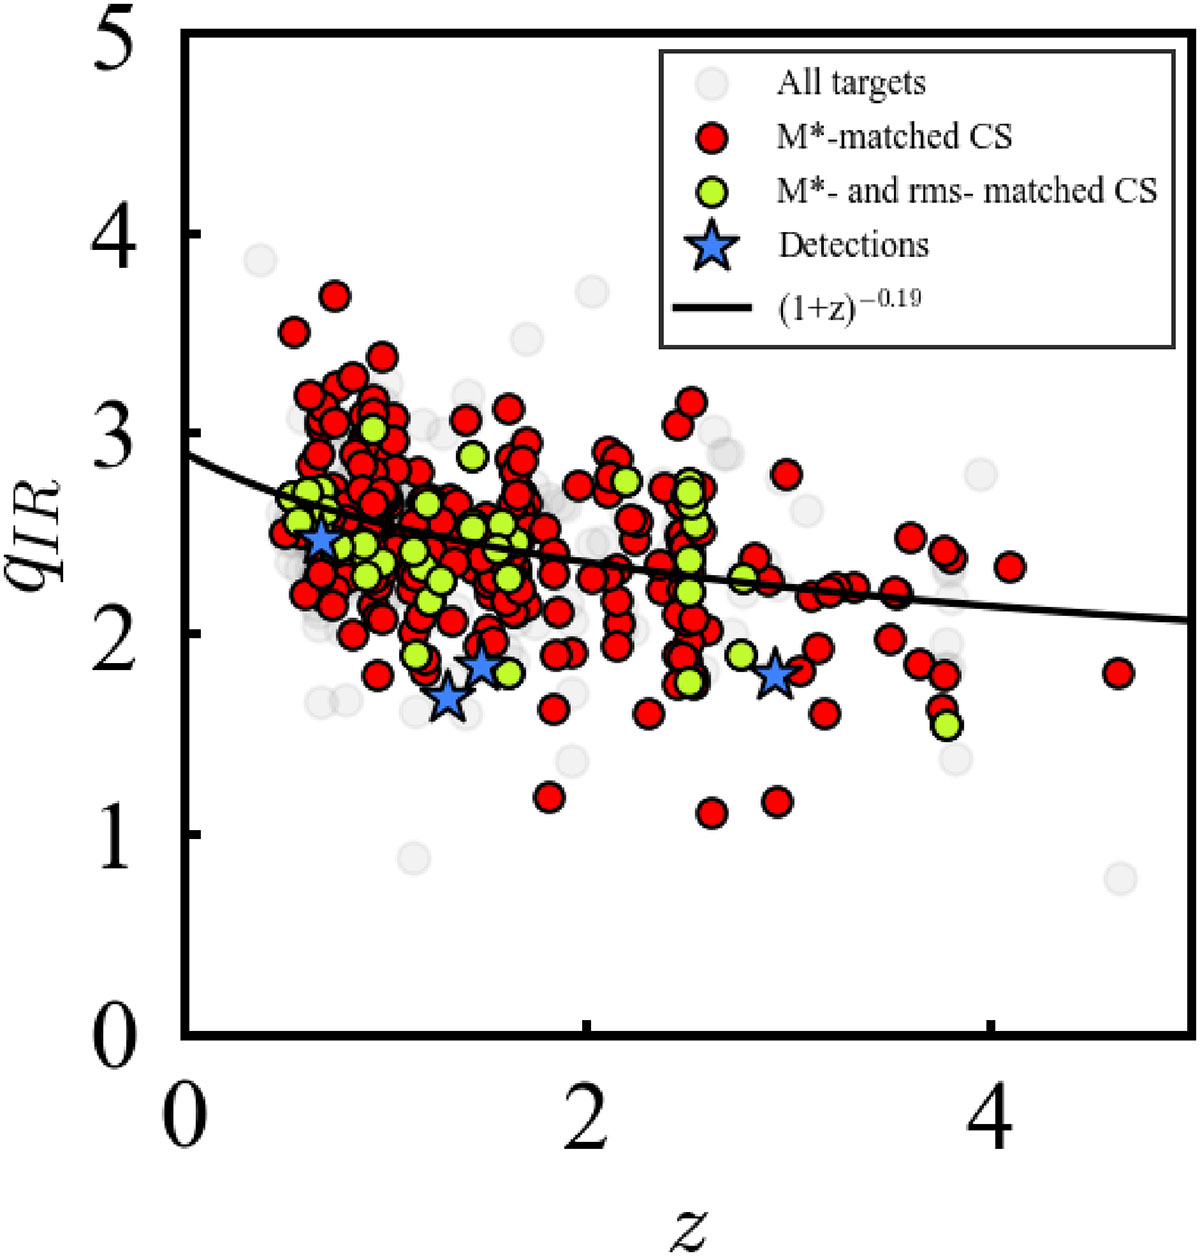
Fig. A.1.
Download original image
qIR as a function of redshift for all the 500 targets (grey points), the 4 VLBA-detected AGN (dark blue stars) and the 277 non-detections that constitute the M★-matched sample (red points). The green dots are the 42 non-detections which make the (M★, rms)-matched control sample. The black line is the NLS fit of all the targets described by the power law (1 + z)−0.13.
Current usage metrics show cumulative count of Article Views (full-text article views including HTML views, PDF and ePub downloads, according to the available data) and Abstracts Views on Vision4Press platform.
Data correspond to usage on the plateform after 2015. The current usage metrics is available 48-96 hours after online publication and is updated daily on week days.
Initial download of the metrics may take a while.