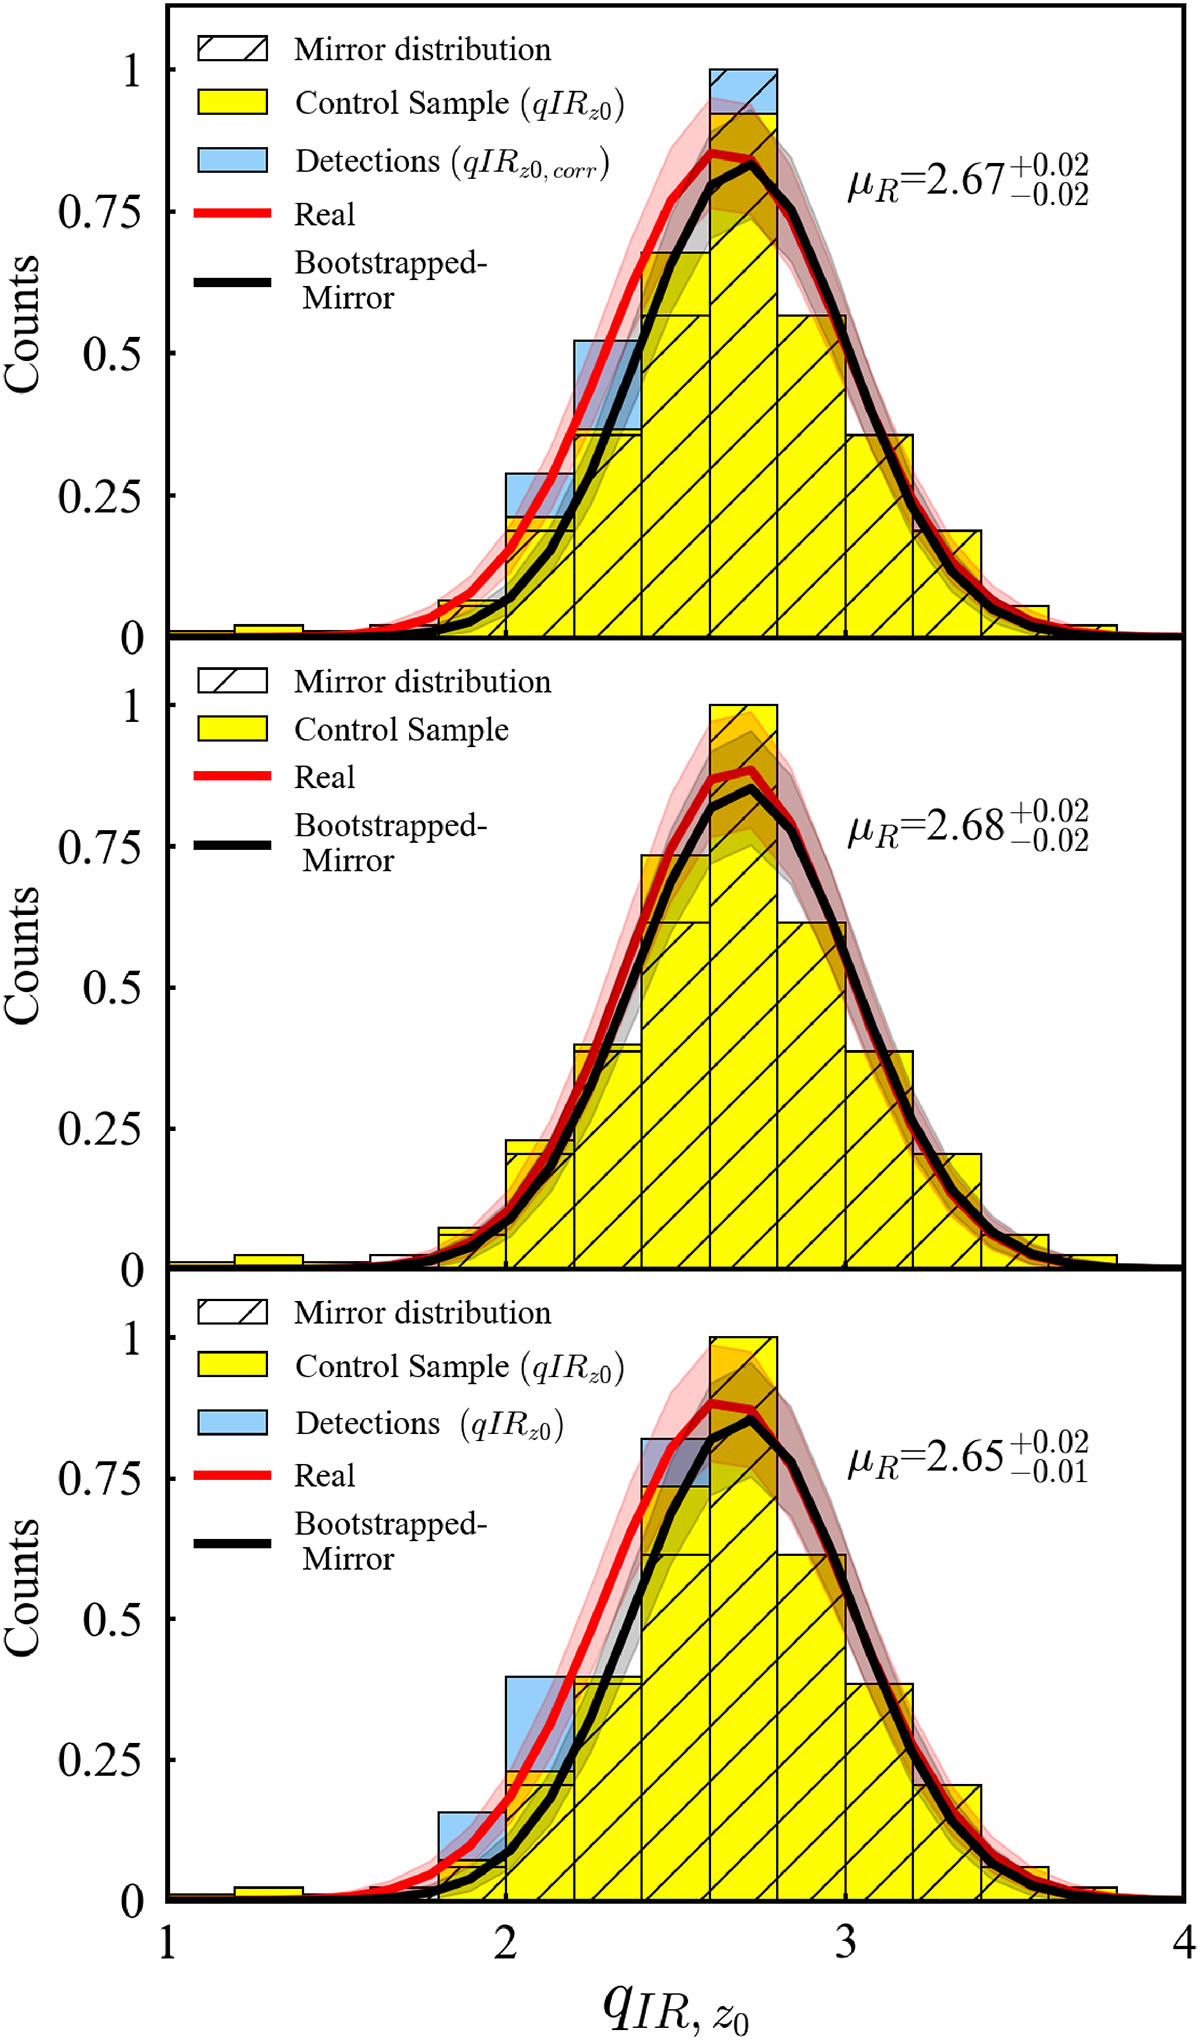
Fig. A.2.
Download original image
Normalized qIR distributions re-scaled to z0 = 0.5 (qIR, z0) for the control sample of VLBA non-detections (yellow histogram), while the 4 detections (light blue histogram) are shown both before (bottom panel) and after the VLBA AGN correction (top panel). The red Gaussian is the fit of the yellow+blue (or yellow) histograms, while the black curve is the Gaussian fit to the bootstrapped mirror distribution.
Current usage metrics show cumulative count of Article Views (full-text article views including HTML views, PDF and ePub downloads, according to the available data) and Abstracts Views on Vision4Press platform.
Data correspond to usage on the plateform after 2015. The current usage metrics is available 48-96 hours after online publication and is updated daily on week days.
Initial download of the metrics may take a while.