Fig. 2.
Download original image
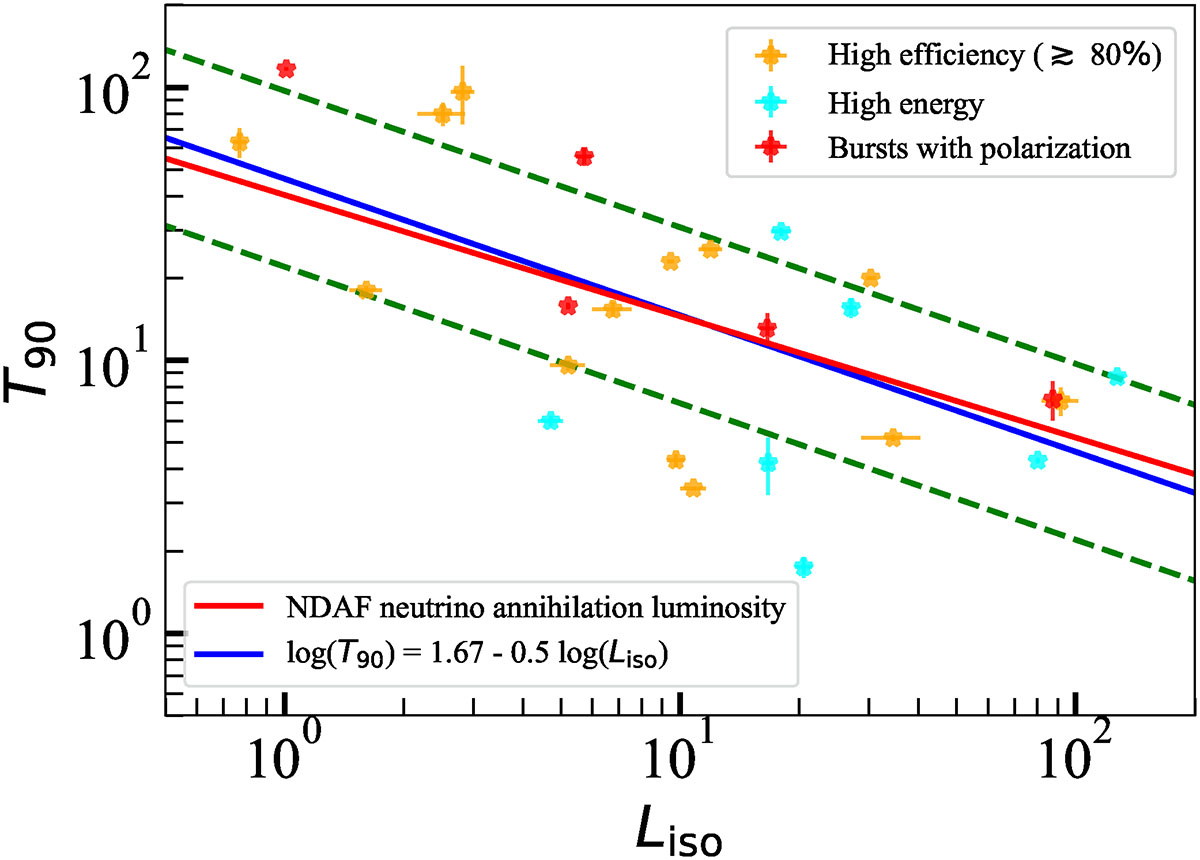
T90 ∝ (Liso)−0.5 correlation (solid blue line) for the GRBs with reported polarization detections (red stars), along with the high-efficiency sample (orange stars; Meng 2022) and the high-energy sample (cyan stars; Eγ, beam ≳1052 erg, obtaining a GeV/TeV detection; Sharma et al. 2021). Notably, all three samples roughly exhibit a power-law shape in their X-ray afterglows. The dashed green lines mark a T90 deviation of a factor of two, from the best-fit log (T90) = 1.67–0.5 log (Liso) relationship. This T90 ∝ (Liso)−0.5 correlation aligns closely with the predictions made by the NDAF model (solid red line), which is under the hot fireball framework.
Current usage metrics show cumulative count of Article Views (full-text article views including HTML views, PDF and ePub downloads, according to the available data) and Abstracts Views on Vision4Press platform.
Data correspond to usage on the plateform after 2015. The current usage metrics is available 48-96 hours after online publication and is updated daily on week days.
Initial download of the metrics may take a while.