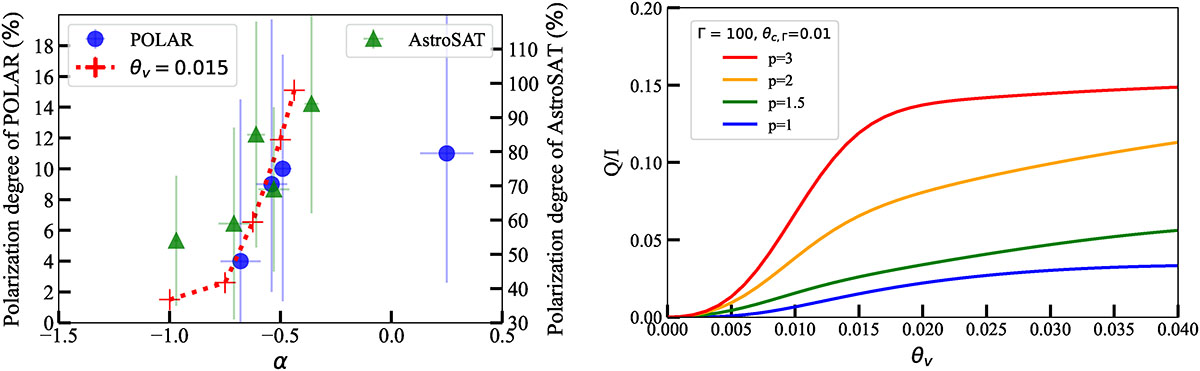
Fig. 4.
Download original image
Apparent positive correlation of the low-energy spectral index α and the polarization degree (left) and the possible photosphere explanation (right, polarization degree Π = |Q|/I). (a) Notably, this positive correlation can be obtained from both the POLAR sample (blue circles, with a Pearson correlation coefficient of r = 0.69) and the AstroSAT bursts (green triangles, r = 0.85). The P values standing for the significance level are both ∼0.06, and thus the correlation is almost significant (combining POLAR and AstroSAT, P ∼ 0.03 can be achieved). (b) For the photosphere polarization, the polarization degree is shown to be positively correlated with the p value (the power-law decreasing index of Γ, for the jet angular distribution), for the smaller θc, Γ case available for bursts with higher energy. Also, for Γ ⋅ θc, Γ ≃ 1, α is positively correlated with the p value, α ≃ ( − 1/4)(1 + 3/p). The predicted positive correlation of α and the polarization degree for θv = 0.015 (red pluses in the left panel) can match the observations of POLAR and the slope of the AstroSAT sample, approximately. Notice that GRB 170127C in POLAR may have larger θc, Γ, thus possessing a larger α of 0.25 and a smaller polarization degree (see Figure 5a, maybe two to three times smaller).
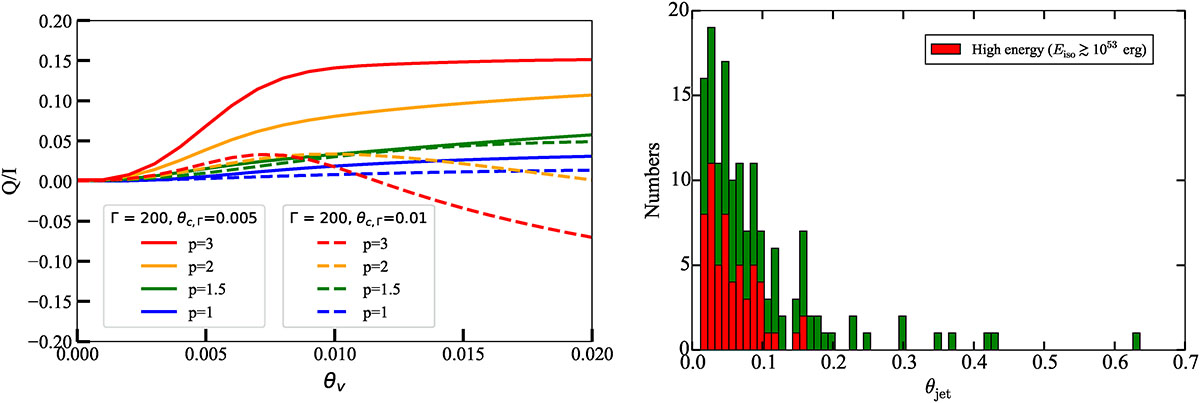
Fig. 5.
Correlations of photosphere polarization degree (Π = |Q|/I), θc, Γ (or θjet), and Eiso. (a) Comparison of the photosphere polarization degree for smaller θc, Γ (Γ ⋅ θc, Γ = 1, solid lines; predicting a much larger polarization degree) and larger θc, Γ (Γ ⋅ θc, Γ = 2, dashed lines; predicting a much smaller polarization degree). (b) The smaller θjet (likely θc, Γ also) is found for the high-energy sample (Eiso ≳ 1053 erg), indicating the polarization detection.

Current usage metrics show cumulative count of Article Views (full-text article views including HTML views, PDF and ePub downloads, according to the available data) and Abstracts Views on Vision4Press platform.
Data correspond to usage on the plateform after 2015. The current usage metrics is available 48-96 hours after online publication and is updated daily on week days.
Initial download of the metrics may take a while.