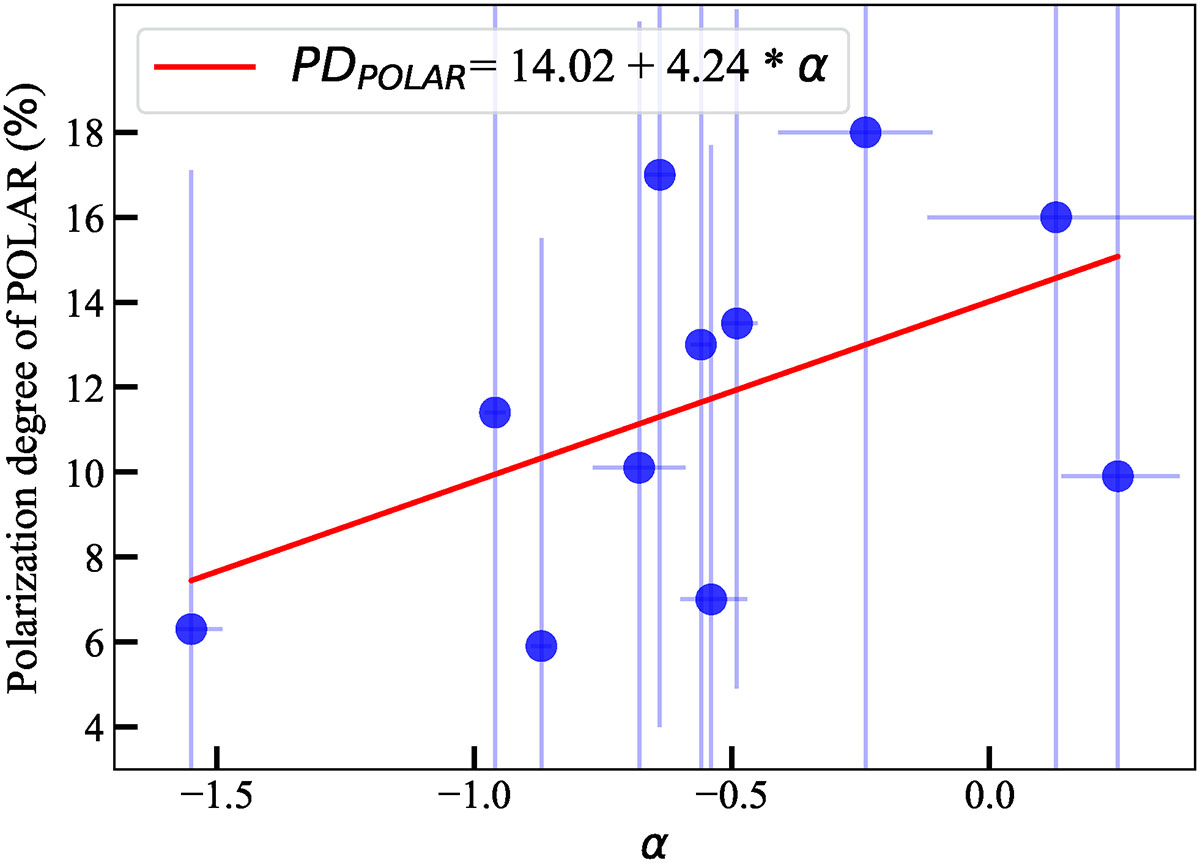
Fig. 6.
Download original image
The α – PD distribution for a larger POLAR sample (blue circles, 11 bursts) in Kole et al. (2020). It can be seen that the positive correlation between α and PD is quite obvious. The solid red line shows the best-fit correlation, which is PD = (14.02 ± 1.81)+(4.24 ± 2.47)⋅α. The correlation is almost significant, with a significance level of 1.72σ.
Current usage metrics show cumulative count of Article Views (full-text article views including HTML views, PDF and ePub downloads, according to the available data) and Abstracts Views on Vision4Press platform.
Data correspond to usage on the plateform after 2015. The current usage metrics is available 48-96 hours after online publication and is updated daily on week days.
Initial download of the metrics may take a while.