Fig. 7.
Download original image
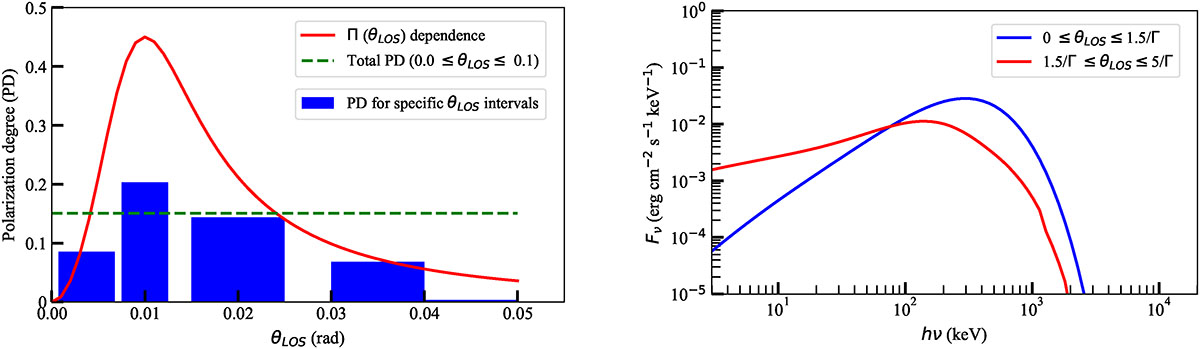
Possible explanation for the PD discrepancy between POLAR and AstroSAT. (a) The PD distribution for the emission from different local fluid elements, relative to the light of sight. Note that Γ = 100, θc, Γ = 0.01, θv = 0.015, and p = 4 were adopted. The solid red line represents the polarization degree of each fluid element with θLOS, without considering the influence of the azimuthal angle ϕLOS (see Equation (5)). The blue boxes illustrate the integrated polarization degree for specific θLOS intervals, considering the influence of the azimuthal angle. The polarization degree obviously rises rapidly, peaks at around θLOS ∼ 1/Γ, and then drops down quickly. The high polarization is almost within ∼1.5/Γ or ∼2/Γ. The dashed green line marks the total polarization degree for 0 ≤ θLOS ≤ 0.1. (b) The comparison of the spectra emitted from 0 ≤ θLOS ≤ 1.5/Γ and 1.5/Γ ≤ θLOS ≤ 5/Γ (Γ = 200, Γ ⋅ θc, Γ = 1, and θv = 1.5/Γ were adopted). Obviously, the spectrum from the inner region (0 ≤ θLOS ≤ 1.5/Γ) has higher energy and a higher PD (as can be seen in the left panel). This may contribute to the larger PD of AstroSAT (100–600 keV), due to its higher band energy and narrower bandwidth than POLAR (50–500 keV). The narrow bandwidth of ∼6 times ultimately enables only the detection of the high-energy component from the inner region (the right portion of the blue line).
Current usage metrics show cumulative count of Article Views (full-text article views including HTML views, PDF and ePub downloads, according to the available data) and Abstracts Views on Vision4Press platform.
Data correspond to usage on the plateform after 2015. The current usage metrics is available 48-96 hours after online publication and is updated daily on week days.
Initial download of the metrics may take a while.