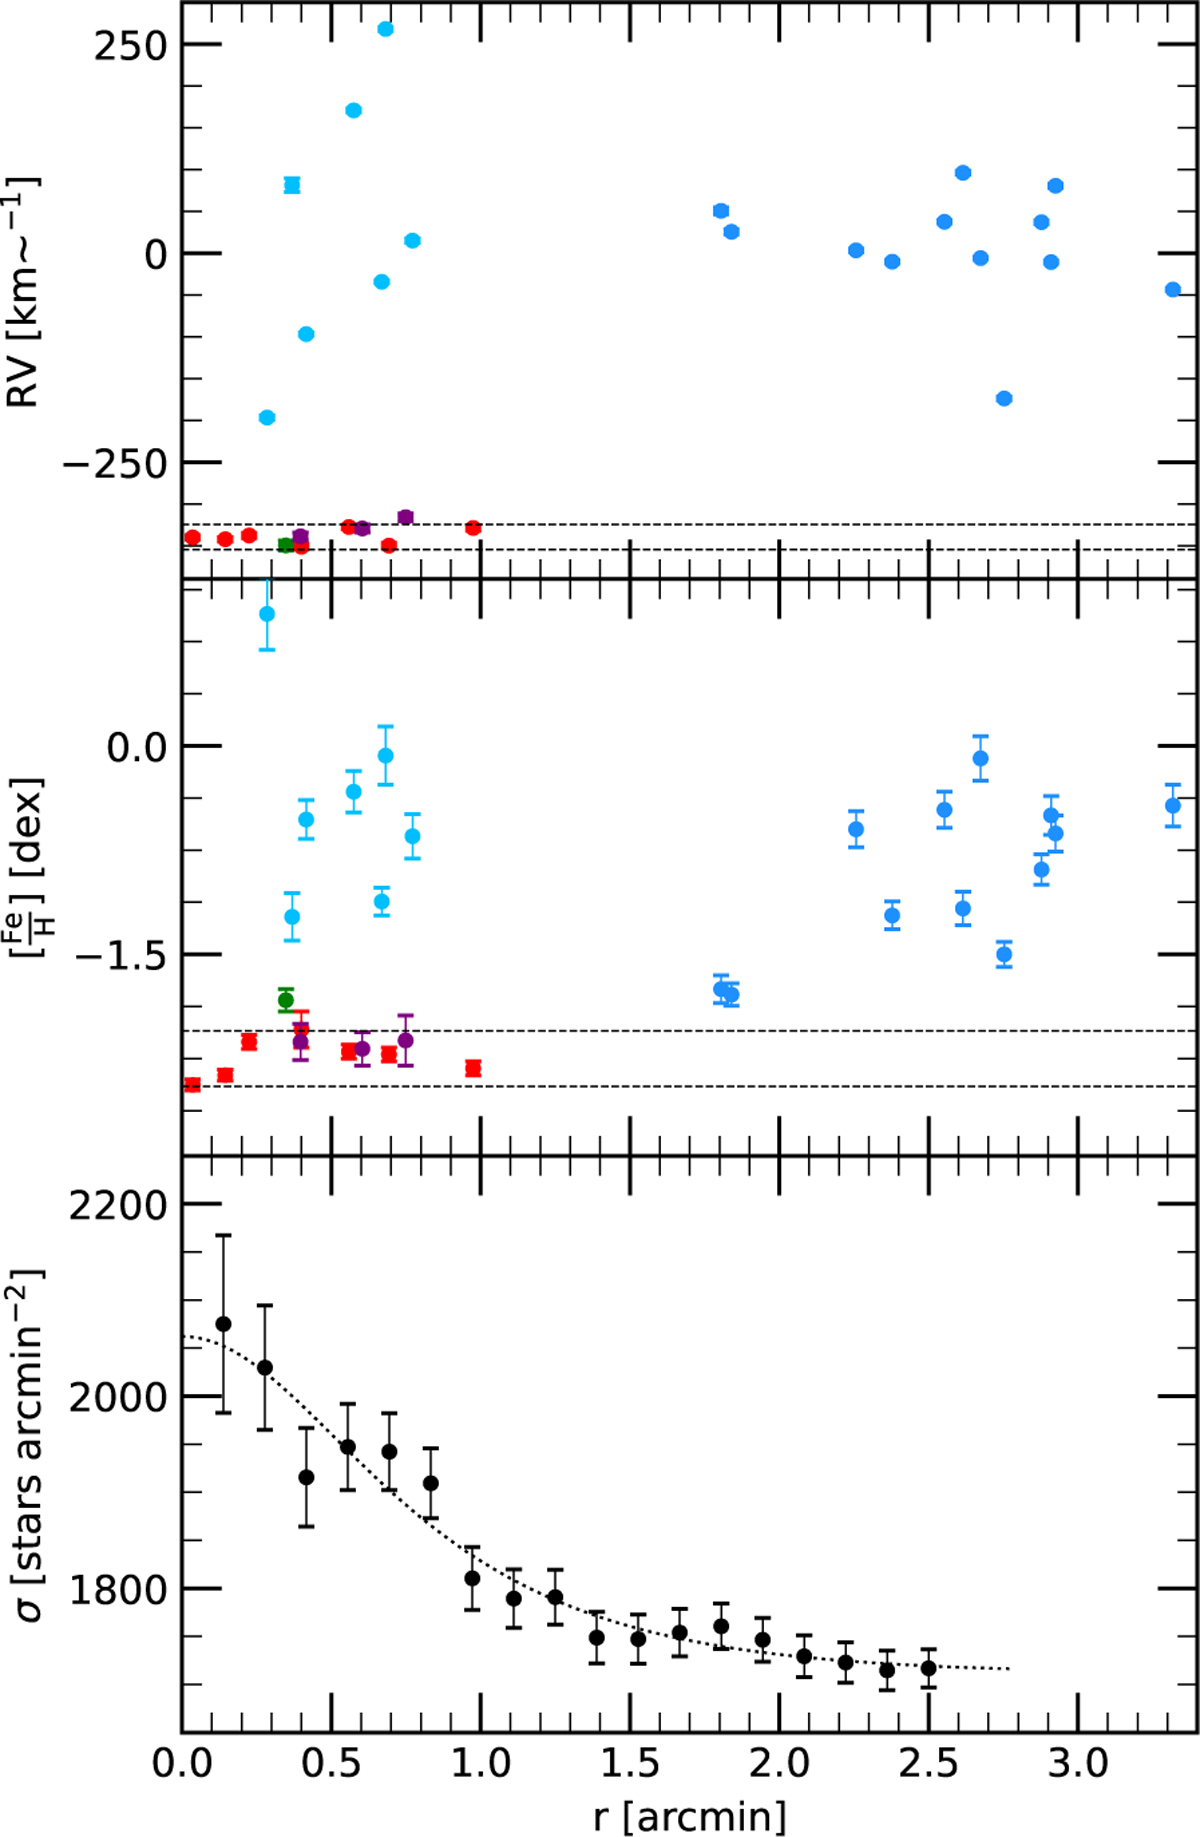
Fig. 4
Download original image
Upper panel: RV of the spectroscopic targets as a function of distance from the cluster center. The horizontal lines represent our velocity cuts (±15 km s−1). Middle panel: metallicity of the spectroscopic targets as a function of distance from the cluster center. The horizontal lines represent our metallicity cuts (±0.20 dex). For both panels the color-coding is the same as in Fig. 3. Lower panel: radial density profile of the photometric sources with respect to the cluster center. The dotted curve indicates the best fit of a King (1962) radial profile.
Current usage metrics show cumulative count of Article Views (full-text article views including HTML views, PDF and ePub downloads, according to the available data) and Abstracts Views on Vision4Press platform.
Data correspond to usage on the plateform after 2015. The current usage metrics is available 48-96 hours after online publication and is updated daily on week days.
Initial download of the metrics may take a while.