Open Access
Fig. 6
Download original image
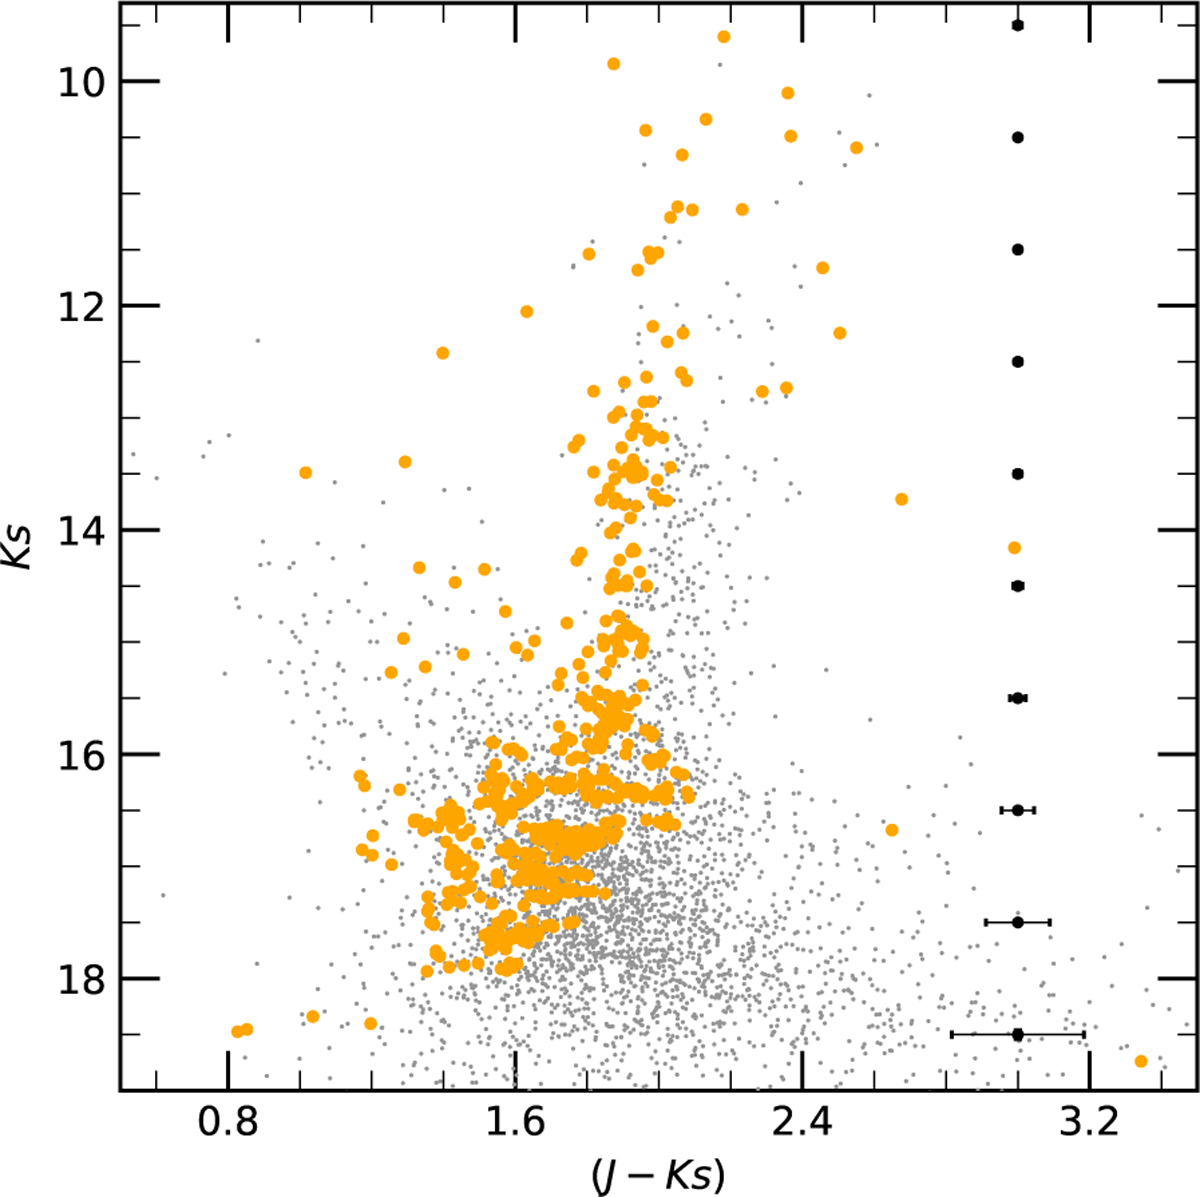
CMD of the photometry obtained in the VVV CL001 field within a radius of 0.′94 from the center of the cluster (gray points). The orange points are the stars resulting from the statistical decontamination process. The black symbols give the average photometric errors per magnitude bin.
Current usage metrics show cumulative count of Article Views (full-text article views including HTML views, PDF and ePub downloads, according to the available data) and Abstracts Views on Vision4Press platform.
Data correspond to usage on the plateform after 2015. The current usage metrics is available 48-96 hours after online publication and is updated daily on week days.
Initial download of the metrics may take a while.