Fig. 7
Download original image
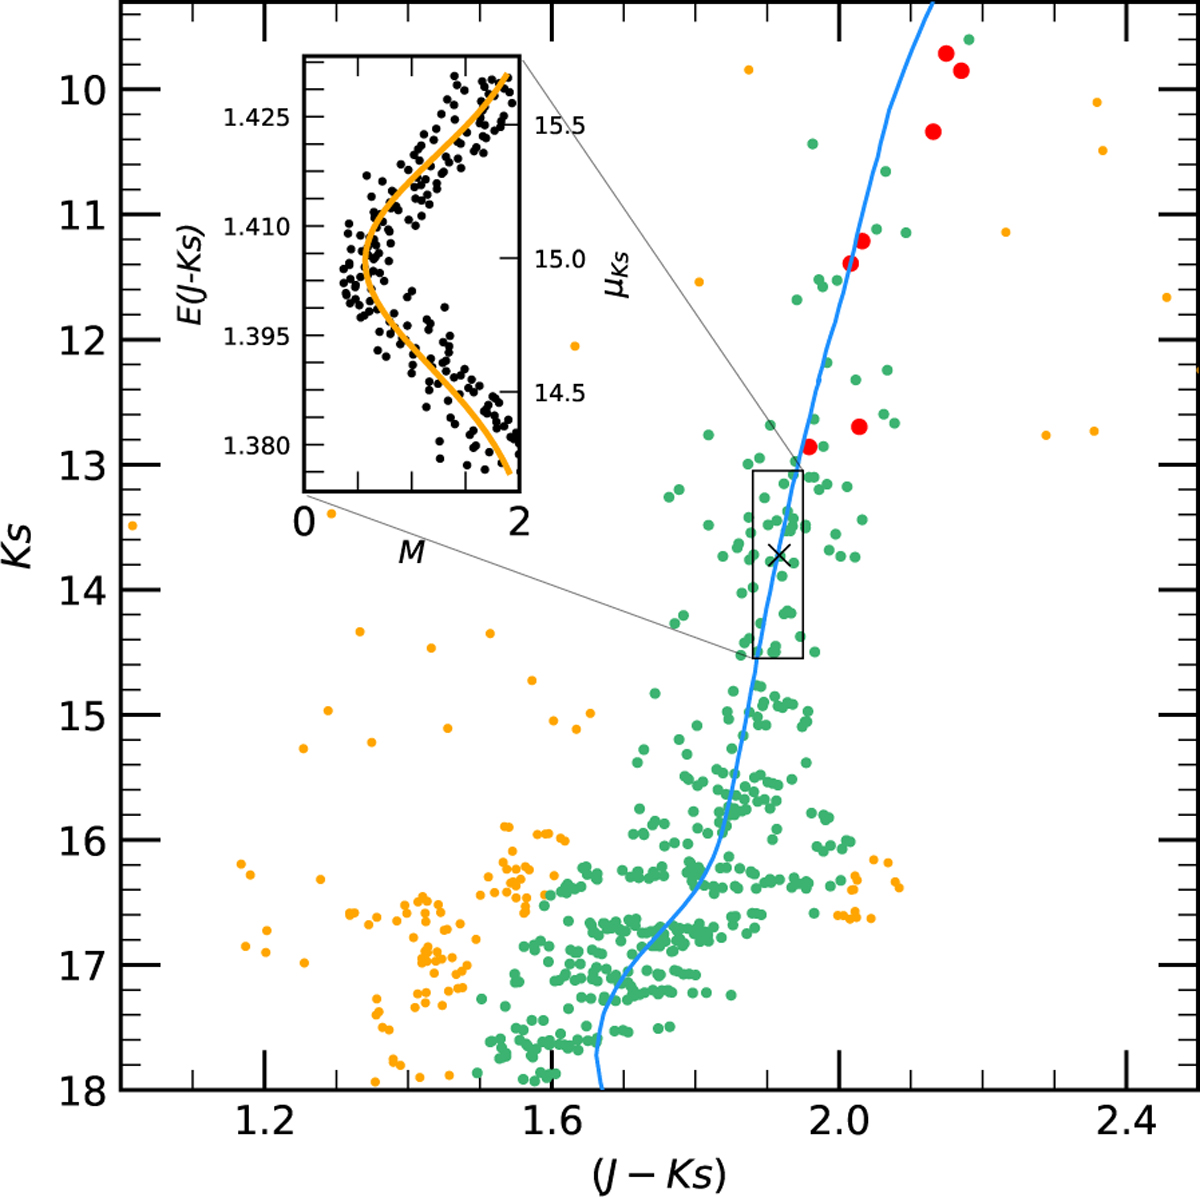
CMD of VVV-CL001. The green points represent stars retained after the re-decontamination process, while the orange points indicate the rejected stars. The red points correspond to CaT-confirmed members of VVV-CL001. The black cross marks the adopted fiducial point, and the blue curve shows the best-fitting theoretical isochrone. Inset: value of the metric M (Eq. (A.4)) for each tested combination of E(J − Ks) and ![]() (black points). The orange curve is the Gaussian fit to these points, used to identify the optimal values of E(J − Ks) and
(black points). The orange curve is the Gaussian fit to these points, used to identify the optimal values of E(J − Ks) and ![]() that minimize M.
that minimize M.
Current usage metrics show cumulative count of Article Views (full-text article views including HTML views, PDF and ePub downloads, according to the available data) and Abstracts Views on Vision4Press platform.
Data correspond to usage on the plateform after 2015. The current usage metrics is available 48-96 hours after online publication and is updated daily on week days.
Initial download of the metrics may take a while.