Fig. 9
Download original image
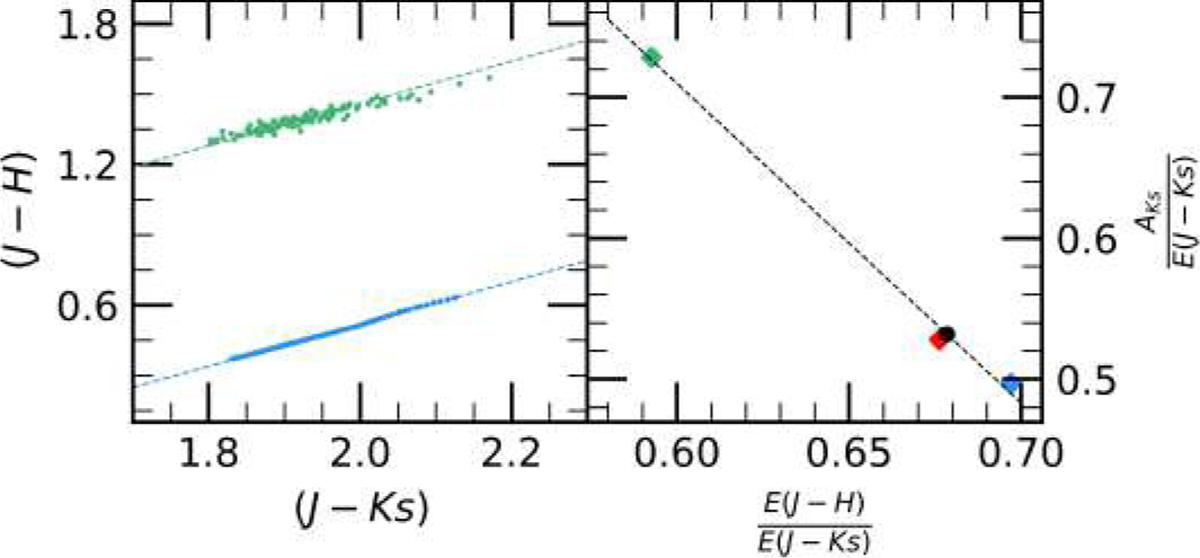
Left panel: Color–Color diagram. Green points: only RGB stars from the photometric data resulting from statistical decontamination. Blue points: best-fit isochrone model from Section 4.4. The green and blue dotted curves show the linear fit of the green and blue points, respectively. Right panel: plane of ![]() vs.
vs. ![]() . Green diamond: standard extinction law of Cardelli et al. (1989) converted to the 2MASS system according to Table 2 of Catelan et al. (2011). Red and blue diamonds: Bulge extinction law of the
. Green diamond: standard extinction law of Cardelli et al. (1989) converted to the 2MASS system according to Table 2 of Catelan et al. (2011). Red and blue diamonds: Bulge extinction law of the ![]() quadrant of Nishiyama et al. (2009) and the average of their four quadrants, respectively. The dotted curve shows the linear fit of these three values. Black point: interpolated value for VVV-CL001.
quadrant of Nishiyama et al. (2009) and the average of their four quadrants, respectively. The dotted curve shows the linear fit of these three values. Black point: interpolated value for VVV-CL001.
Current usage metrics show cumulative count of Article Views (full-text article views including HTML views, PDF and ePub downloads, according to the available data) and Abstracts Views on Vision4Press platform.
Data correspond to usage on the plateform after 2015. The current usage metrics is available 48-96 hours after online publication and is updated daily on week days.
Initial download of the metrics may take a while.