Fig. 1.
Download original image
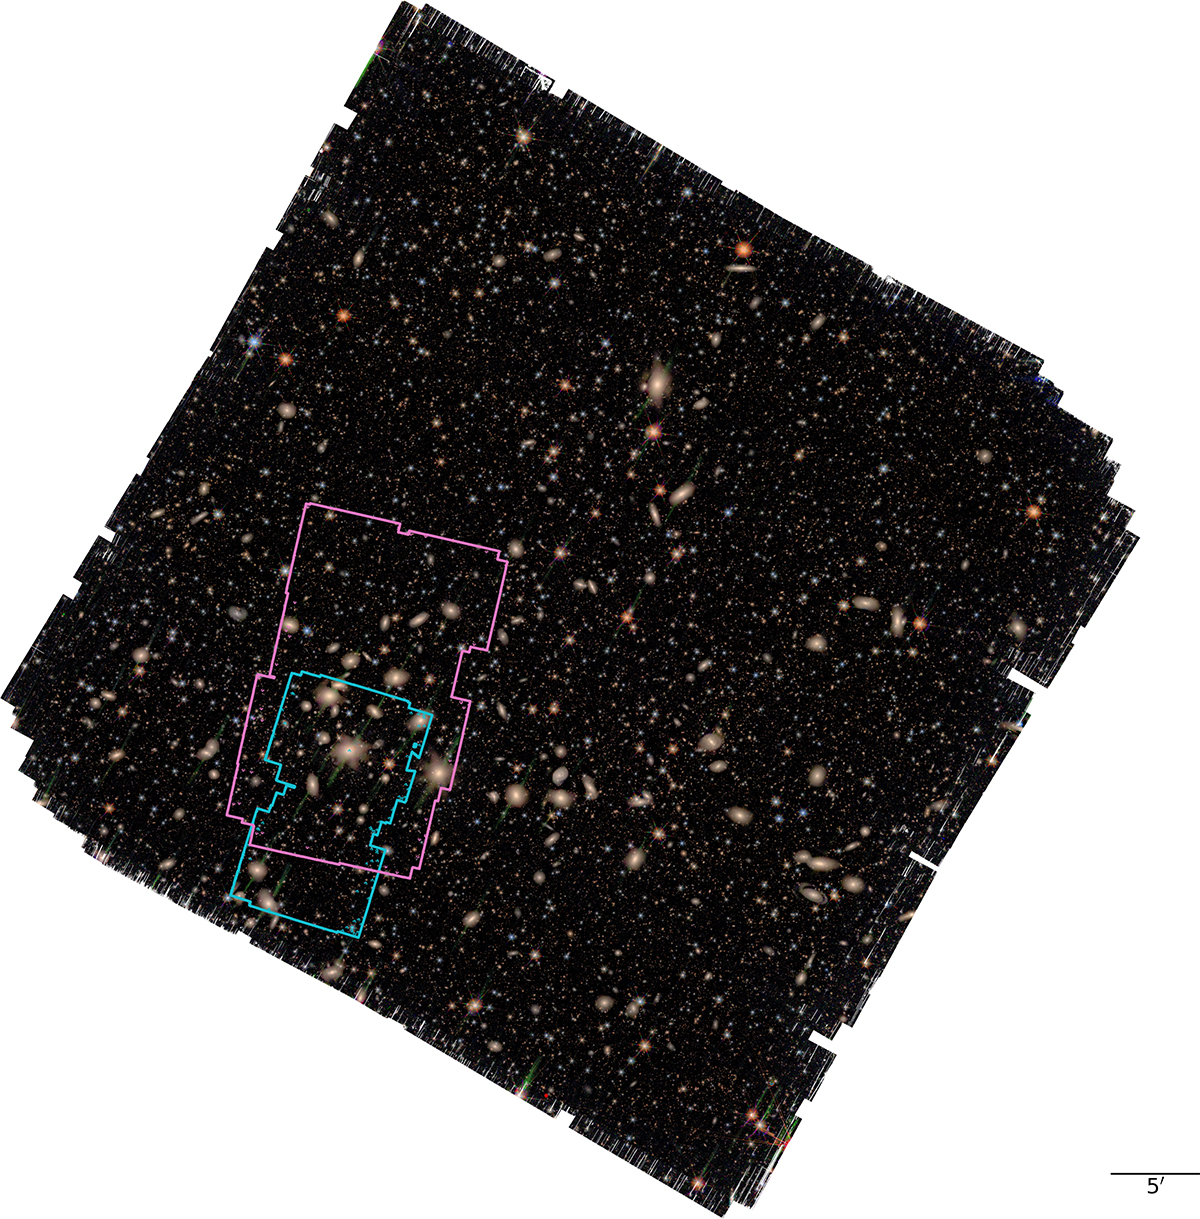
Euclid red-green-blue image of the Perseus cluster made by combining the images taken through the three NISP filters. The solid coloured lines show the extent of the two Spitzer/IRAC datasets, with the cyan and magenta lines showing the extent of the first and second pointings, respectively. The images have been aligned with the WCS coordinate system, with north up and east to the left. In the low-right corner, a scale bar representing 5 arcmin is shown.
Current usage metrics show cumulative count of Article Views (full-text article views including HTML views, PDF and ePub downloads, according to the available data) and Abstracts Views on Vision4Press platform.
Data correspond to usage on the plateform after 2015. The current usage metrics is available 48-96 hours after online publication and is updated daily on week days.
Initial download of the metrics may take a while.