Fig. 5.
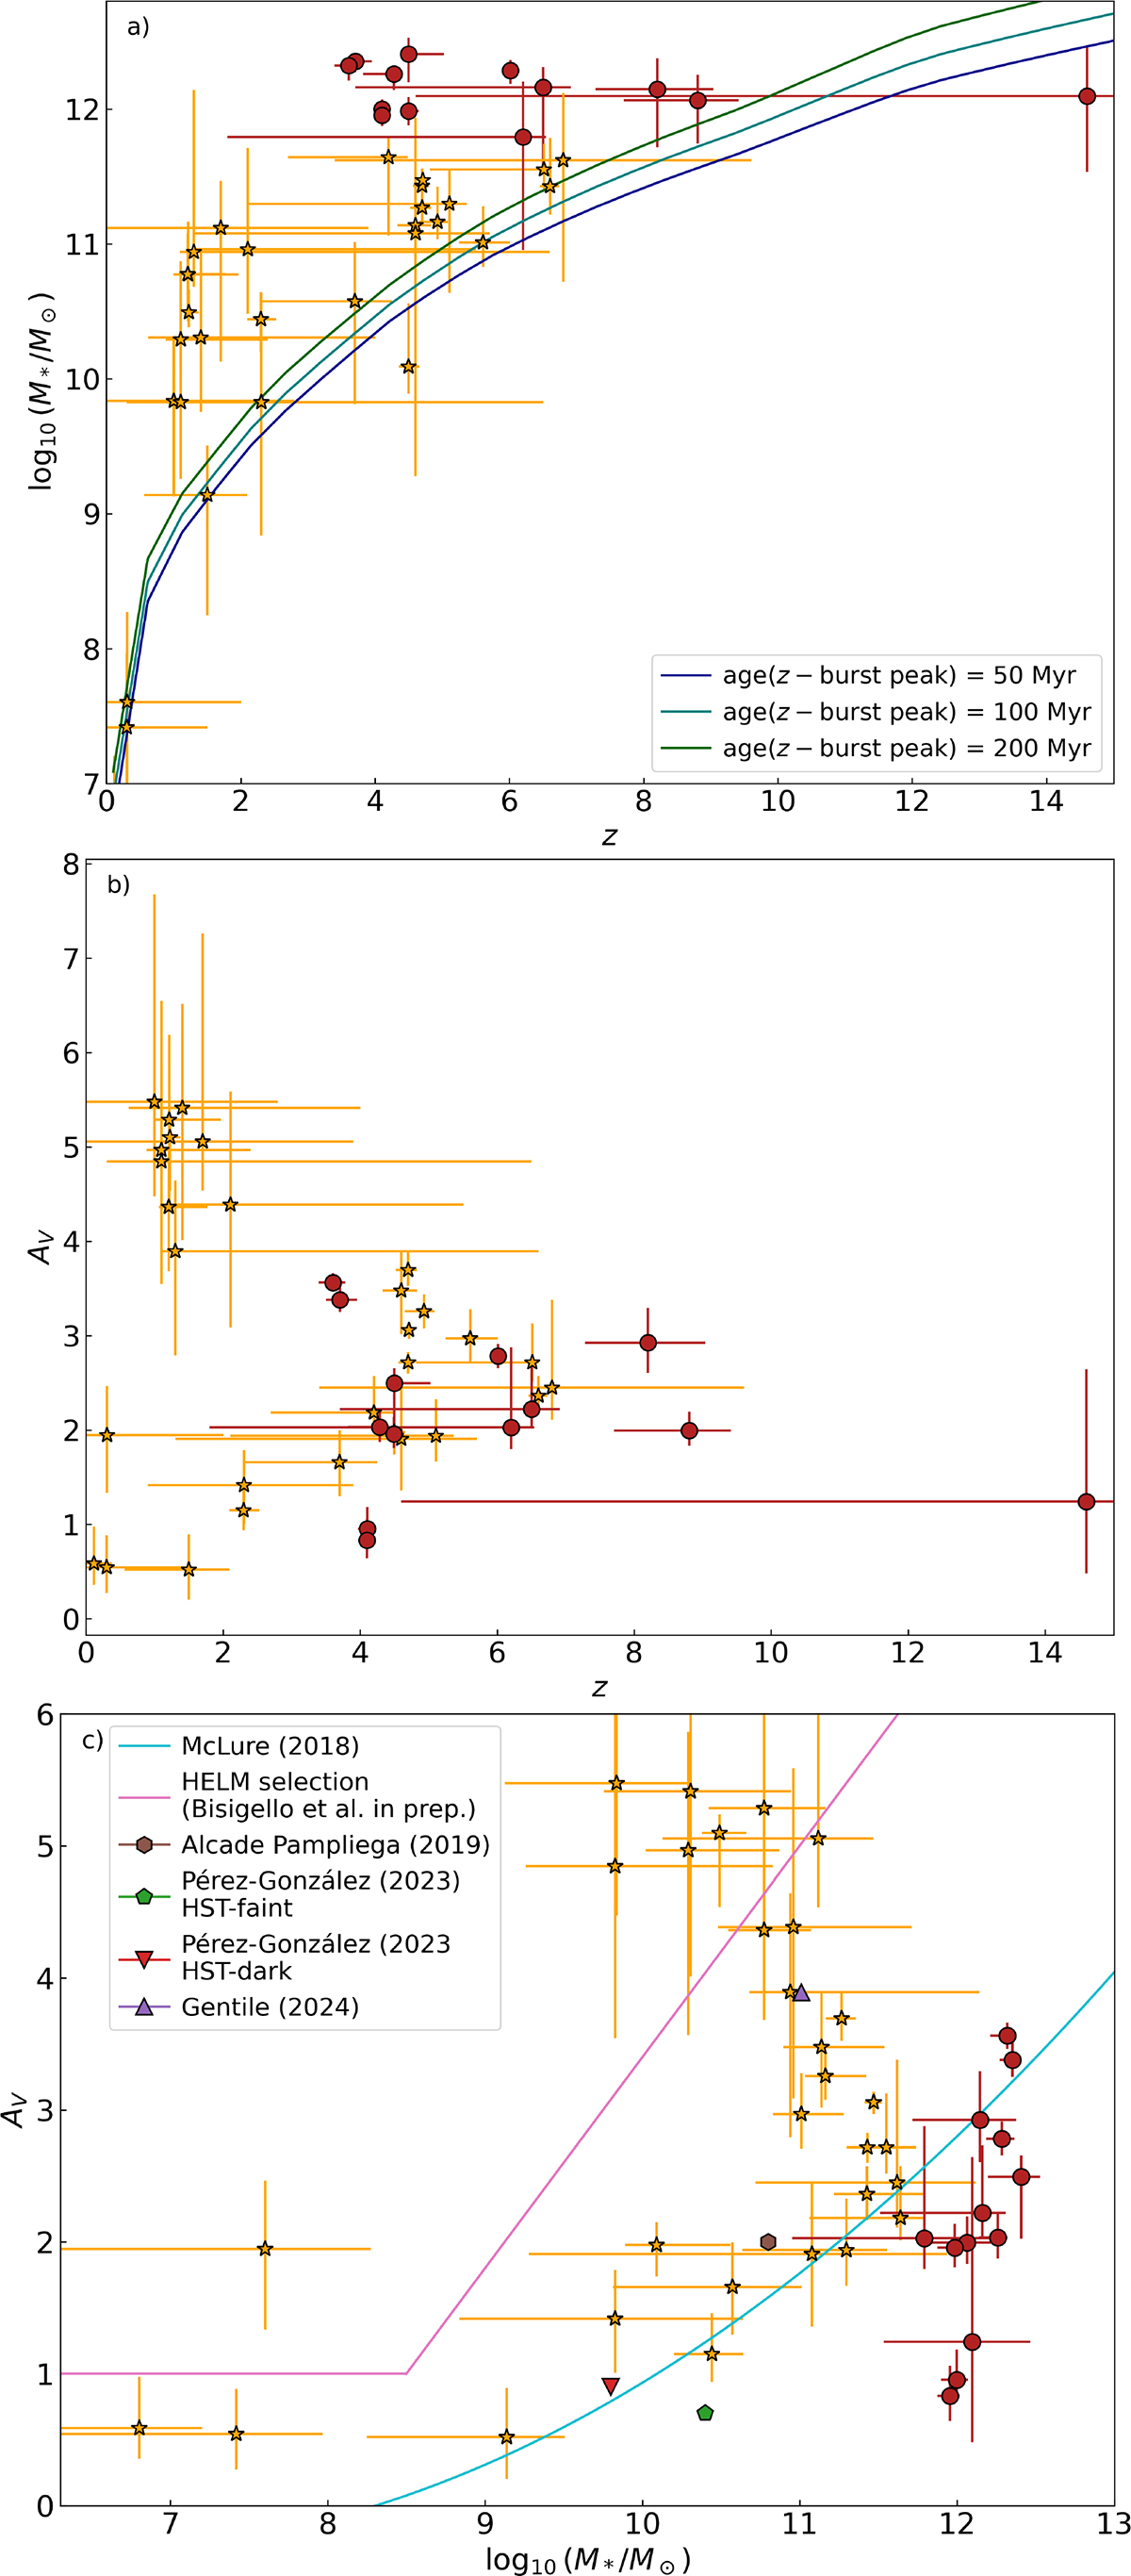
Download original image
Properties of the HIEROs. Panel (a): Redshift versus stellar mass. The red circles show the most massive candidates, with stellar mass greater than 1011.7 M⊙. These objects are from here on defined as ‘over-massive’ and shown with the same symbol, i.e. red circles, in all other panels. The solid lines report the minimum observable stellar mass producing an IRAC ch2 magnitude of 22.7. All three curves represent star-forming galaxies, the green with an age between the redshift epoch and the burst peak of 200 Myr, the teal one 100 Myr, and the dark blue one 50 Myr. Panel (b): Redshift versus dust attenuation distribution. Panel (c): Dust attenuation versus stellar mass. The solid cyan line shows the relation from McLure et al. (2018), while the magenta line delimits the area identifying the so-called HELM galaxies (Bisigello et al. 2025). Different symbols report values from previous studies, as indicated in the legend.
Current usage metrics show cumulative count of Article Views (full-text article views including HTML views, PDF and ePub downloads, according to the available data) and Abstracts Views on Vision4Press platform.
Data correspond to usage on the plateform after 2015. The current usage metrics is available 48-96 hours after online publication and is updated daily on week days.
Initial download of the metrics may take a while.