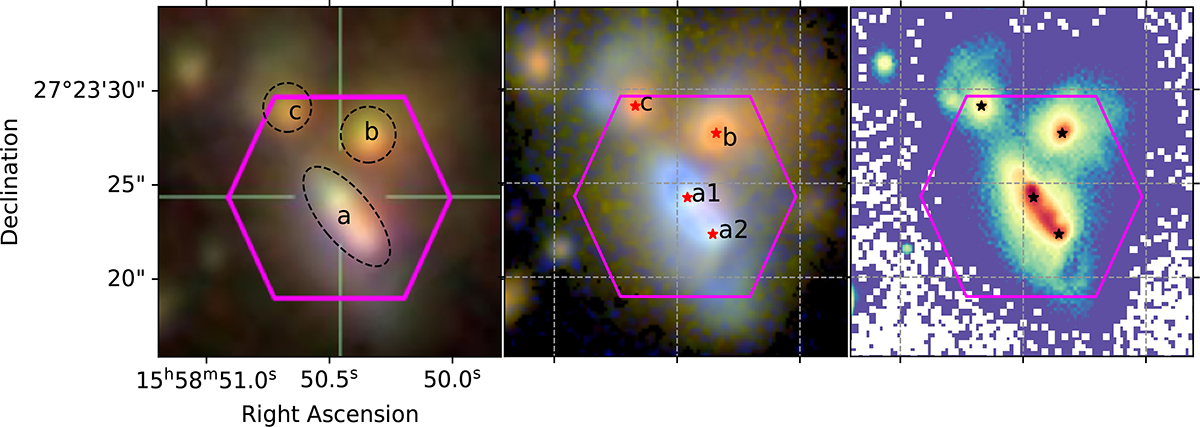
Fig. 1.
Download original image
SDSS (Data Release 12) gri image (left), MegaPipe ugr image (centre), and unsharp masking of the MegaPipe r-band image (right), with the MaNGA field of view overlaid in magenta. The three main stellar regions are segregated and marked as (a, b, c) on the SDSS image. The centres of the regions, with a subdivision of the a region into two galaxies, are shown on the MegaPipe images.
Current usage metrics show cumulative count of Article Views (full-text article views including HTML views, PDF and ePub downloads, according to the available data) and Abstracts Views on Vision4Press platform.
Data correspond to usage on the plateform after 2015. The current usage metrics is available 48-96 hours after online publication and is updated daily on week days.
Initial download of the metrics may take a while.