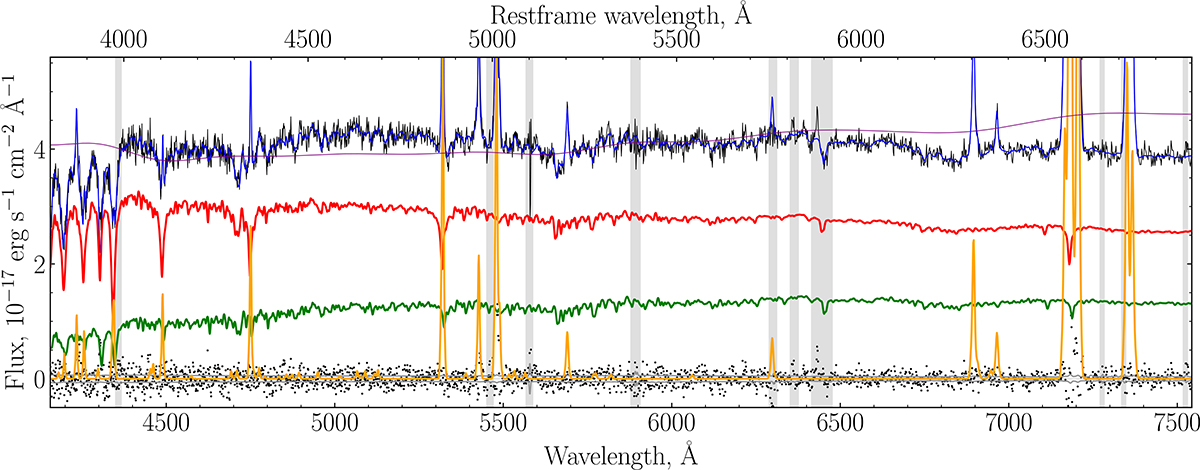
Fig. B.1.
Download original image
Example of two-component NBURSTS fitting for the region with a1 and b galaxies. The black line shows the observed spectrum in the spaxel, and blue is the total best-fitting model. Red and green lines are stellar components of a1 and b galaxies, and the orange line is the emission line component. Black dots are residuals, and the grey line shows the spectrum errors. The shaded regions were excluded from fitting, and the purple line is the multiplicative continuum. The growing trend from the blue to the red spectrum part of the multiplicative continuum is a correction for the extinction.
Current usage metrics show cumulative count of Article Views (full-text article views including HTML views, PDF and ePub downloads, according to the available data) and Abstracts Views on Vision4Press platform.
Data correspond to usage on the plateform after 2015. The current usage metrics is available 48-96 hours after online publication and is updated daily on week days.
Initial download of the metrics may take a while.