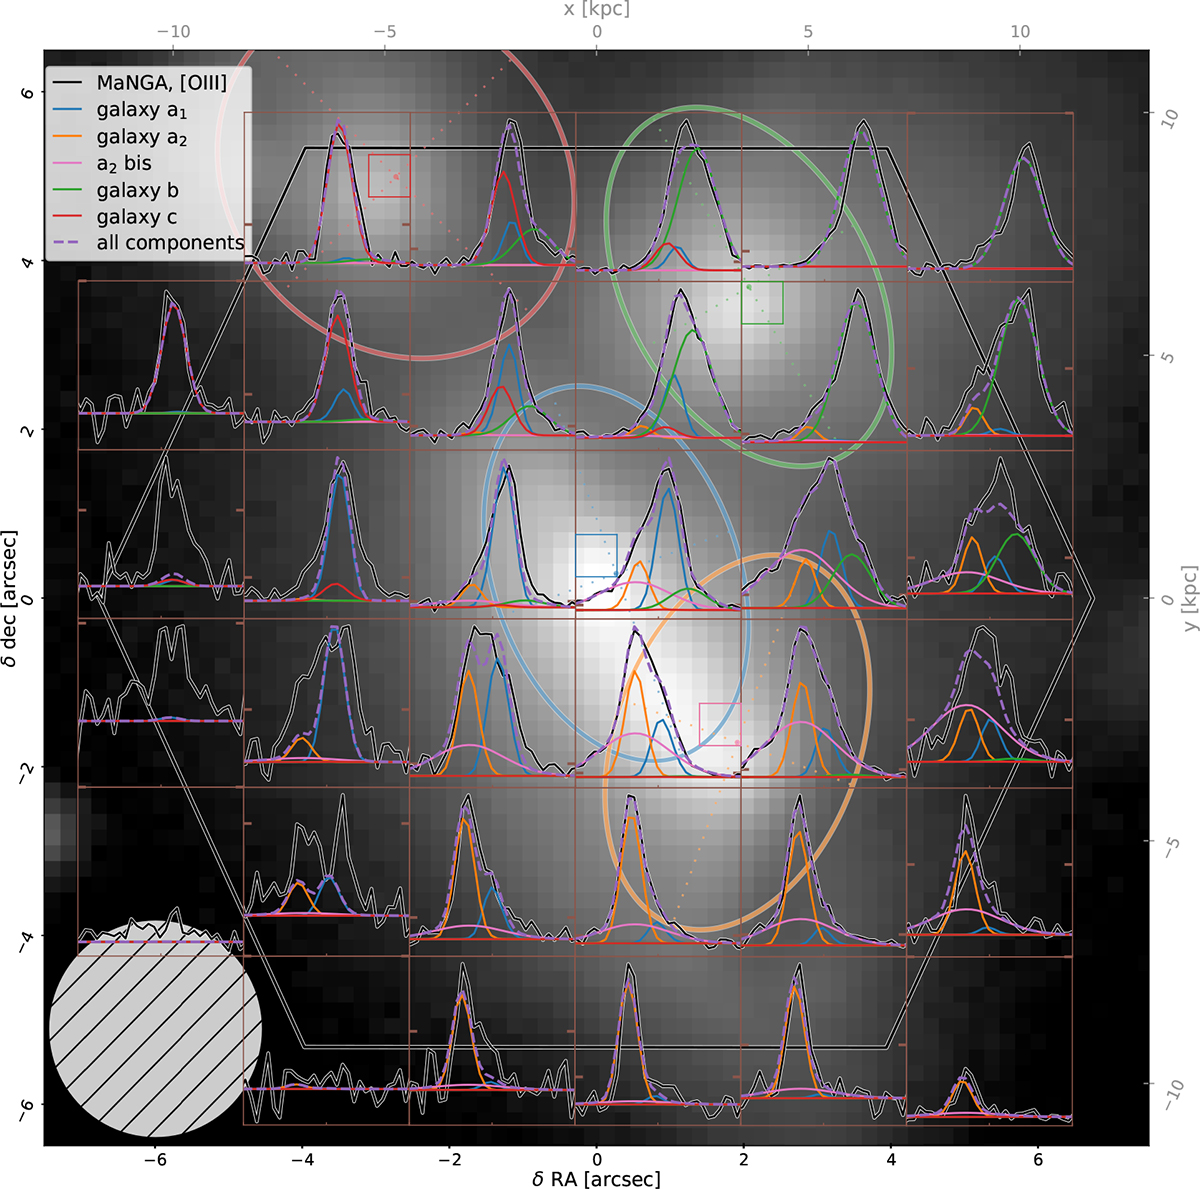
Fig. C.1.
Download original image
[O III]5008 Angstroms MaNGA observations and models of four galaxies and a broad component (a2, bis), superimposed on the MegaCam r-band image. MaNGA pixels encompassing the centre of each modelled component are shown. Fits were done on original MaNGA spaxels, but for the figure MaNGA spectra and our fits are binned 16 by 16 and shown in brown boxes encompassing these binned spaxels. The velocity axis of each box is from -1000 to 1000 km/s. The two same ticks for values 0, on the baseline of spectra, and 0.01 are shown on the left and right y axes of each box to show the scale that is adapted to each box. The Gaussian reconstructed MaNGA PSF is shown on the bottom left. The MaNGA hexagonal field of view is represented in black.
Current usage metrics show cumulative count of Article Views (full-text article views including HTML views, PDF and ePub downloads, according to the available data) and Abstracts Views on Vision4Press platform.
Data correspond to usage on the plateform after 2015. The current usage metrics is available 48-96 hours after online publication and is updated daily on week days.
Initial download of the metrics may take a while.