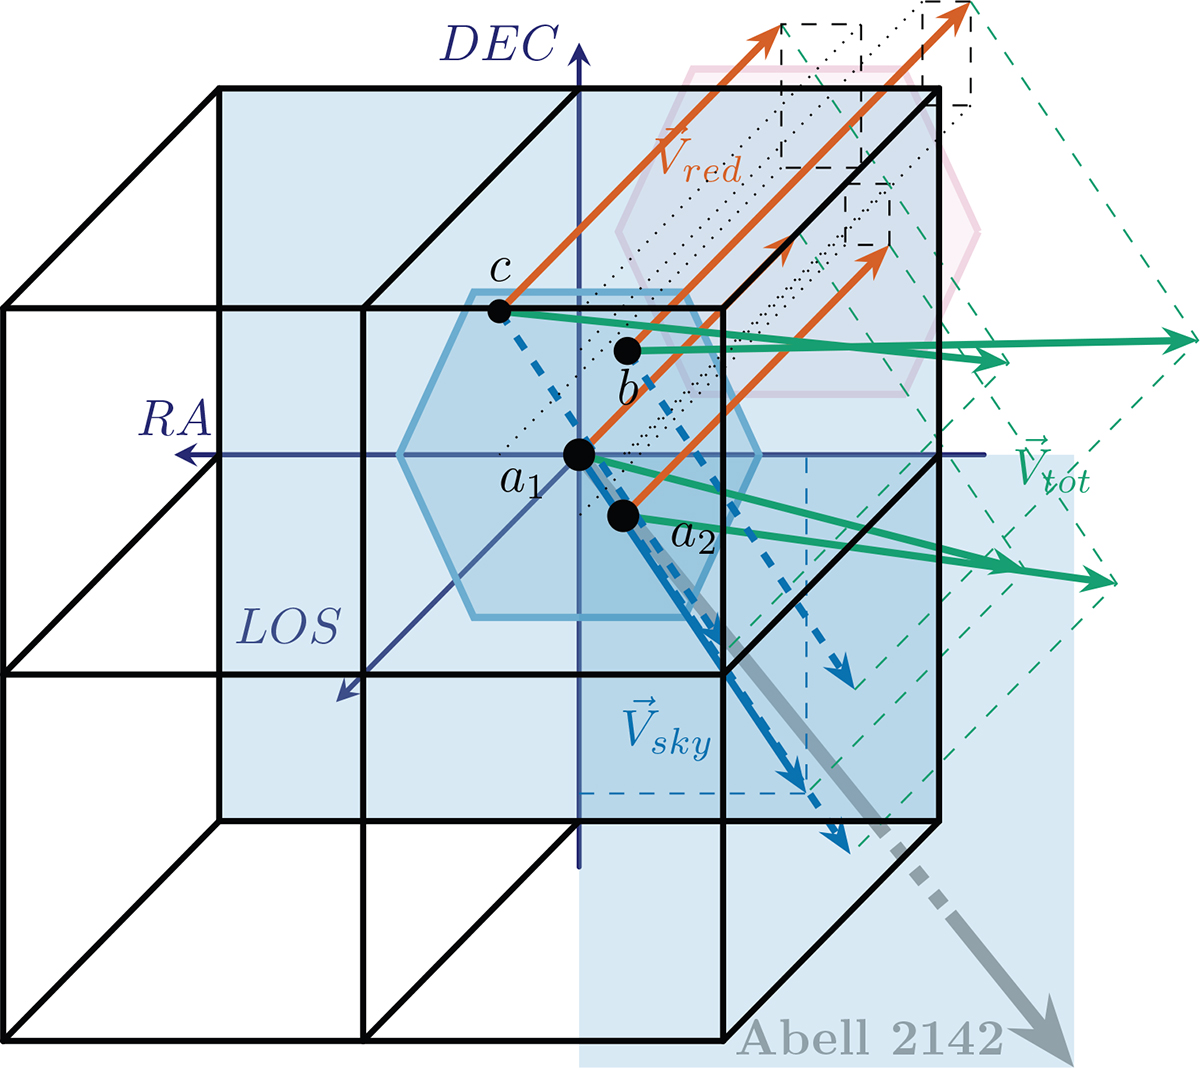
Fig. C.2.
Download original image
Kinematical configuration. The four black bullets correspond to the position of the four galaxies on the sky. 3D velocities, labelled Vtot and associated with each galaxy, are displayed as green arrows. Velocities in the plane of the sky, as derived from the X-ray tail, are displayed as blue arrows. The radial velocities associated with the redshift of each galaxy are displayed in orange. The filled rectangles lie in the plane of the sky as well as the MaNGA hexagonal field and are displayed in blue. (In order to give an overview of the 3D effect, we added a purple hexagon projected at the main redshift velocity.) The grey arrow (in the plane of the sky) points towards the centre of A2142.
Current usage metrics show cumulative count of Article Views (full-text article views including HTML views, PDF and ePub downloads, according to the available data) and Abstracts Views on Vision4Press platform.
Data correspond to usage on the plateform after 2015. The current usage metrics is available 48-96 hours after online publication and is updated daily on week days.
Initial download of the metrics may take a while.