Fig. 2.
Download original image
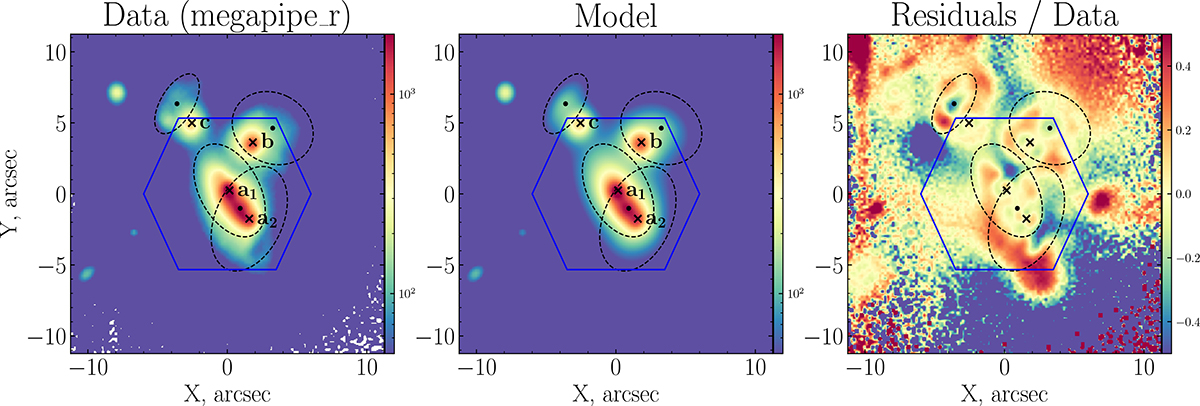
Photometric modelling of the CFHT MegaPipe r-band image using GALFIT. Blue hexagons show the MaNGA field of view, ‘x’ symbols indicate the centres of the ‘core’ components, dots near the c and b components indicate the centres of the ‘outskirts’ components, and the dot between a1 and a2 is the centre of the‘bridge’ between them (see Sect. 3.1.2). Dashed ellipses show the effective radius of the most ‘extended’ component of each galaxy, based on the parameters from Table 2. Third panel shows the residuals-to-data ratio. The colour bar unit is proportional to the analogue-to-digital unit.
Current usage metrics show cumulative count of Article Views (full-text article views including HTML views, PDF and ePub downloads, according to the available data) and Abstracts Views on Vision4Press platform.
Data correspond to usage on the plateform after 2015. The current usage metrics is available 48-96 hours after online publication and is updated daily on week days.
Initial download of the metrics may take a while.