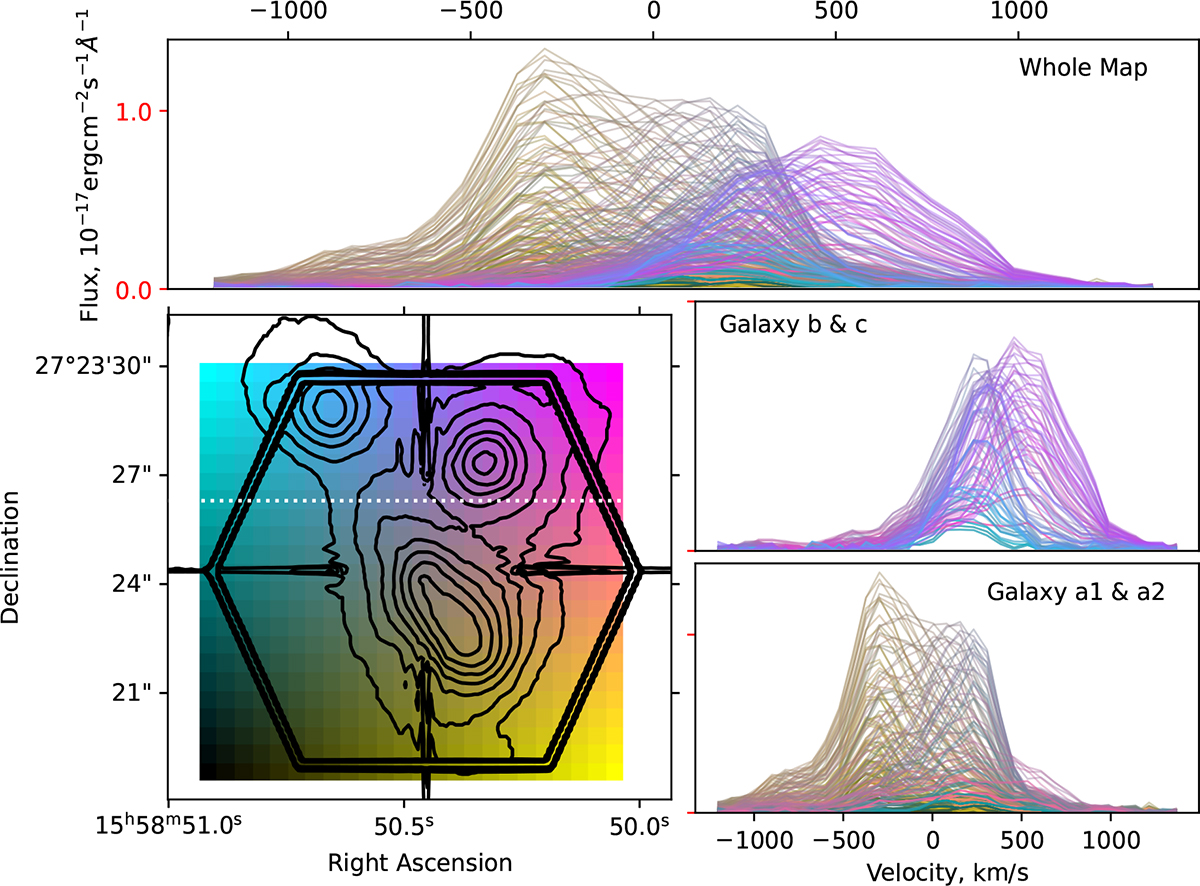
Fig. 6.
Download original image
Superposition of all [O III] lines from each pixel, colour-coded by the position of the pixel (as shown in the left panel). Bottom left: SDSS g-band image (black contours). The hexagon is the field of view of MaNGA. Top: Spectra of the whole map. Middle right: Top half of the field (i.e. the field above the dotted white line in the bottom-left panel), emphasising regions where galaxies b and c are present. Bottom right: Bottom half of the field, highlighting areas where galaxies a1 and a2 are situated.
Current usage metrics show cumulative count of Article Views (full-text article views including HTML views, PDF and ePub downloads, according to the available data) and Abstracts Views on Vision4Press platform.
Data correspond to usage on the plateform after 2015. The current usage metrics is available 48-96 hours after online publication and is updated daily on week days.
Initial download of the metrics may take a while.