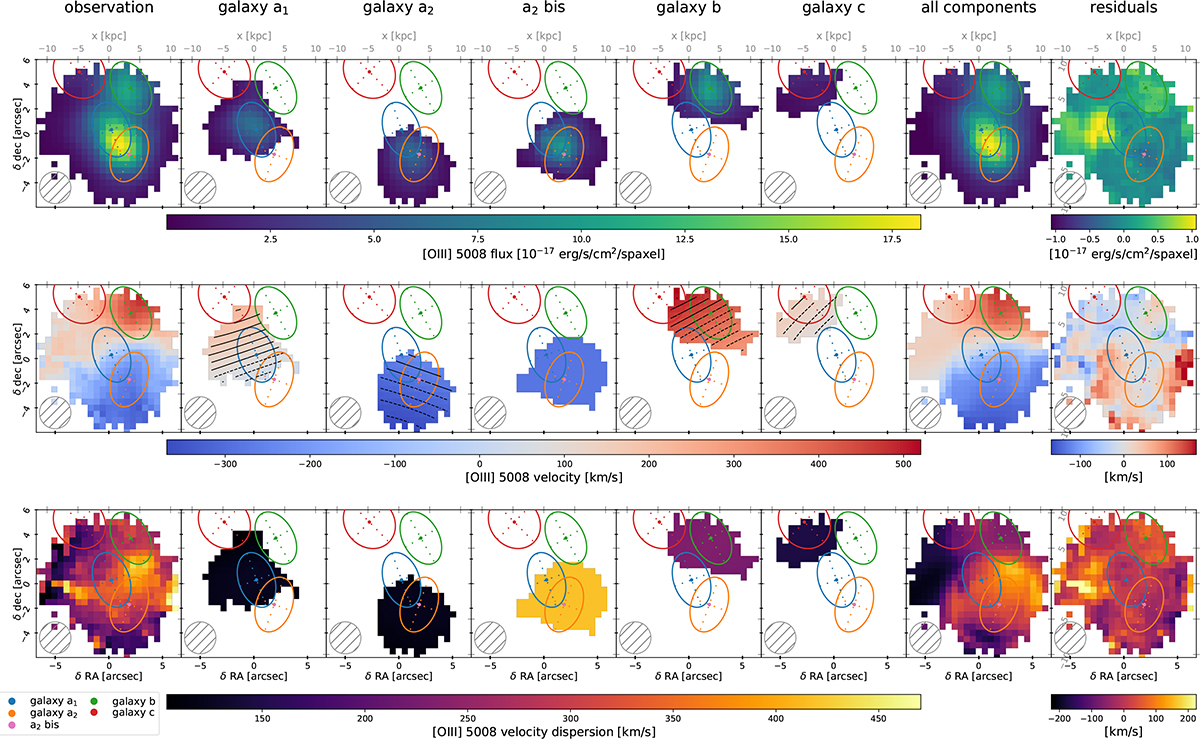
Fig. 7.
Download original image
Observations, models, and residuals of the flux, velocity, and velocity dispersion from the [O III]5008 Angstrom line. Models are shown for each component (Cols. 2 to 6) and for the five components together (Col. 7). Residuals (Col. 8) are the observation (Col. 1) minus the model (Col. 7). On the velocity maps of individual galaxies, iso-LOS velocity curves are represented in dashed (solid) black lines for values below (above) the systemic velocity of each galaxy.
Current usage metrics show cumulative count of Article Views (full-text article views including HTML views, PDF and ePub downloads, according to the available data) and Abstracts Views on Vision4Press platform.
Data correspond to usage on the plateform after 2015. The current usage metrics is available 48-96 hours after online publication and is updated daily on week days.
Initial download of the metrics may take a while.