Fig. 9.
Download original image
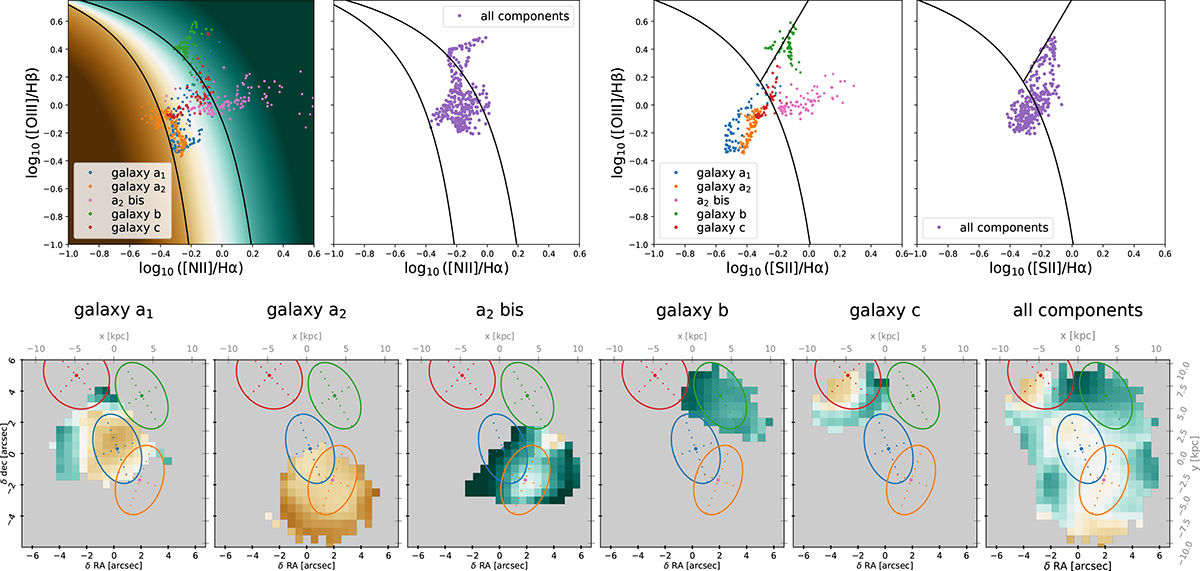
BPT diagrams. Top row, from left to right: [N II] BPT for the five individual components, [N II] BPT for all the components together, [S II] BPT for the five individual components, [S II] BPT for all the components together. Bottom row: Maps with each pixel colour-coded according to the location on the BPT [N II] diagram shown in the top-left panel. Ellipses (or single dot for a2, bis) show the locations of the different components, with the same colour code as in Fig. 7.
Current usage metrics show cumulative count of Article Views (full-text article views including HTML views, PDF and ePub downloads, according to the available data) and Abstracts Views on Vision4Press platform.
Data correspond to usage on the plateform after 2015. The current usage metrics is available 48-96 hours after online publication and is updated daily on week days.
Initial download of the metrics may take a while.