Fig. 2
Download original image
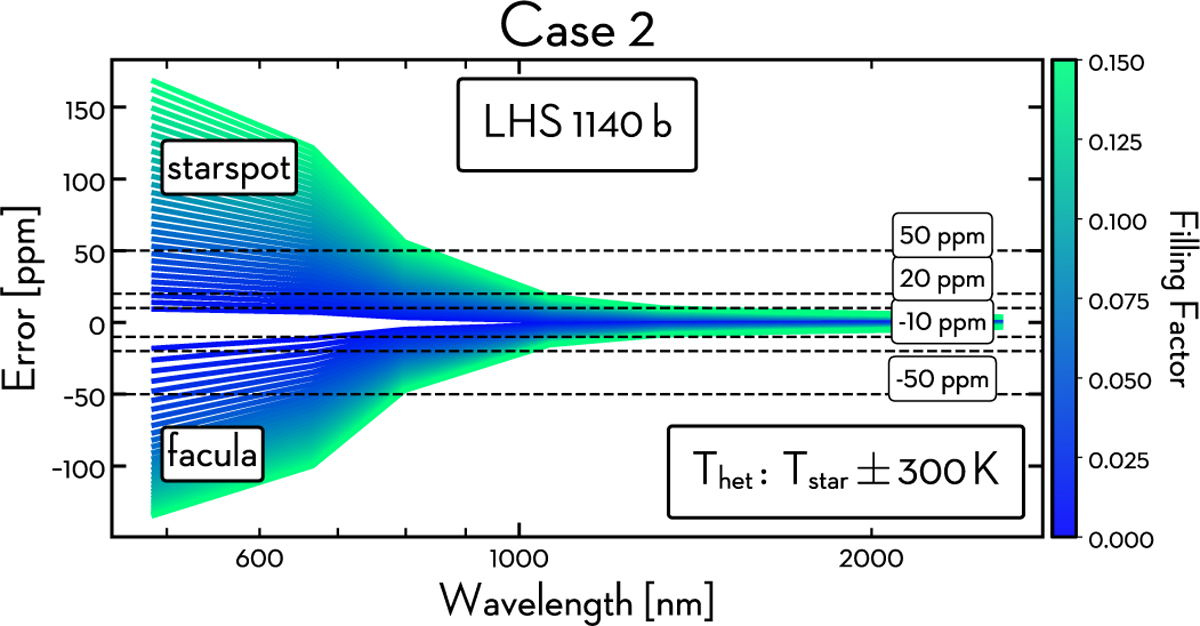
Discrepancies, defined by Eq. (6), as a function of fixed temperature contrast (Tstar ± 300) and with the filling factor (fhet) varied from 0.01 to 0.15. Positive errors (R-TLSE overestimation) dominate for cool spots, while negative errors (R-TLSE underestimation) arise for hot faculae. Extreme cases (e.g., fhet = 0.15, ΔT = ±300 K) show maximal divergence. The dashed lines delineate boundaries at −50, −20, −10, 10, 20, and 50 ppm.
Current usage metrics show cumulative count of Article Views (full-text article views including HTML views, PDF and ePub downloads, according to the available data) and Abstracts Views on Vision4Press platform.
Data correspond to usage on the plateform after 2015. The current usage metrics is available 48-96 hours after online publication and is updated daily on week days.
Initial download of the metrics may take a while.