Fig. 3
Download original image
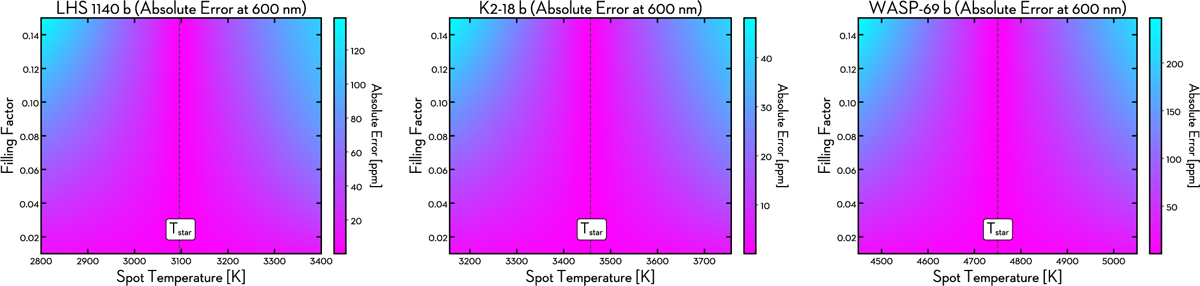
2D parameter space exploration showing the discrepancies (Eq. (6)) at a representative wavelength of 600 nm. Each panel corresponds to a different exoplanetary system: LHS 1140 b (left panel), K2-18 b (middle panel), and WASP-69 b (right panel). Color scales indicate the difference between our model and the R-TLSE correction equation, as a function of filling factor and temperature contrast.
Current usage metrics show cumulative count of Article Views (full-text article views including HTML views, PDF and ePub downloads, according to the available data) and Abstracts Views on Vision4Press platform.
Data correspond to usage on the plateform after 2015. The current usage metrics is available 48-96 hours after online publication and is updated daily on week days.
Initial download of the metrics may take a while.