Fig. 5
Download original image
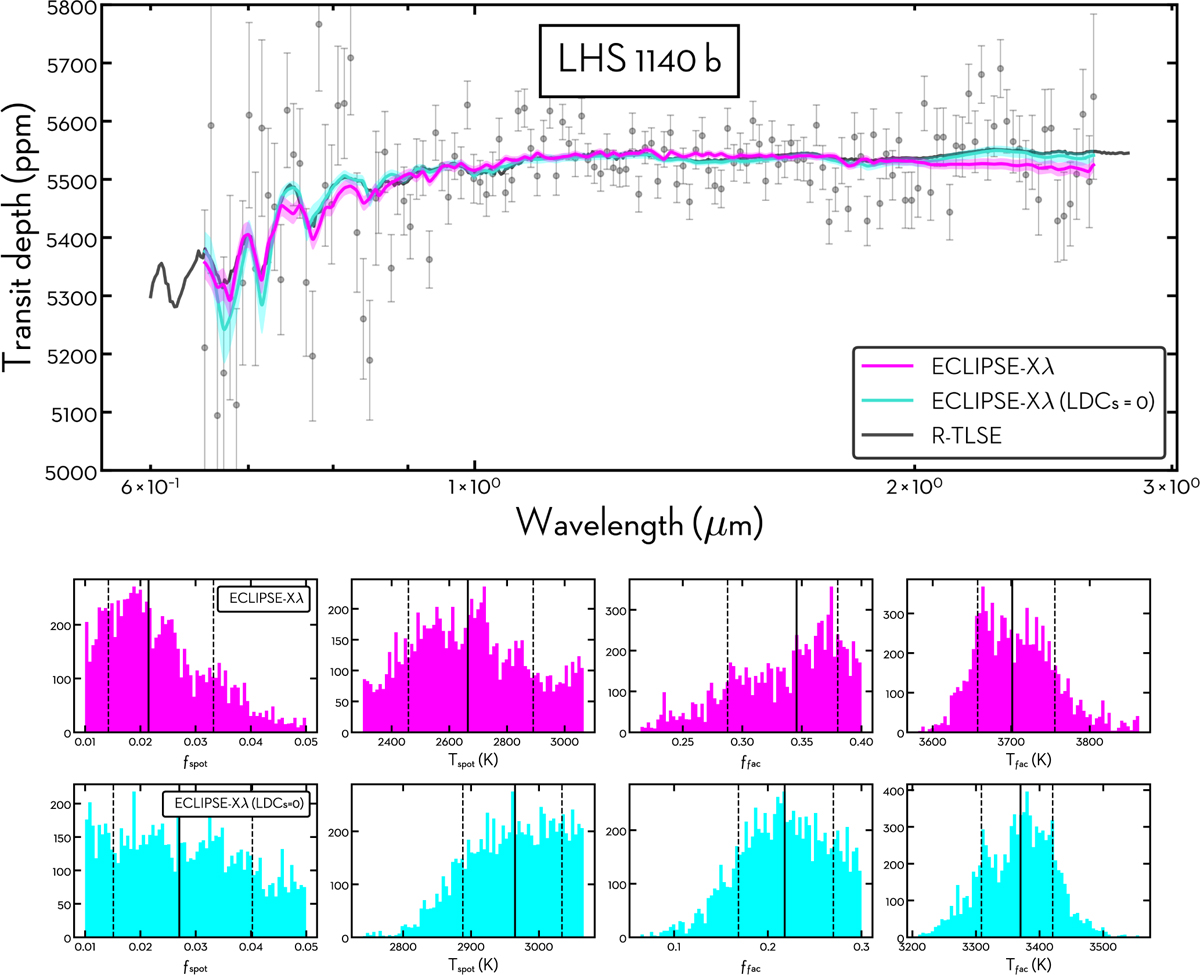
Comparison between ECLIPSE-Xλ and the R-TLSE approximation for the JWST/NIRISS SOSS transmission spectrum of LHS 1140 b. Top: combined R ~ 100 NIRISS spectrum (gray points with error bars), together with the best-fitting stellar-contamination models. The magenta curve shows the self-consistent ECLIPSE-Xλ fit that includes wavelength-dependent limb darkening, the cyan curve shows the corresponding fit with limb darkening set to zero (LDCs = 0), and the black curve reproduces the TLS-only stellar-contamination model from the R-TLSE reference retrieval (see Cadieux et al. 2024). The small-scale structure along the model curves follows atomic and molecular absorption bands in the underlying PHOENIX spectra: TiO/VO and metal lines dominate in the optical, while broad features in the NIR are mainly shaped by H2O bands and CO absorption complexes longward of ~2.2 μm, i.e., precisely the wavelength ranges where exoplanet transmission spectra are usually interpreted in terms of H2O, CH4, and CO absorption. Bottom: 1D marginal distributions for the stellar-contamination parameters in the ECLIPSE-Xλ fits, for the cases with limb darkening (top row, magenta) and with LDCs= 0 (bottom row, cyan). From left to right, panels show the filling factor and temperature of spots (fspot, Tspot) and faculae (ffac, Tfac). Vertical lines indicate the median (solid) and 16th–84th percentile (dashed) intervals reported in Table 2.
Current usage metrics show cumulative count of Article Views (full-text article views including HTML views, PDF and ePub downloads, according to the available data) and Abstracts Views on Vision4Press platform.
Data correspond to usage on the plateform after 2015. The current usage metrics is available 48-96 hours after online publication and is updated daily on week days.
Initial download of the metrics may take a while.