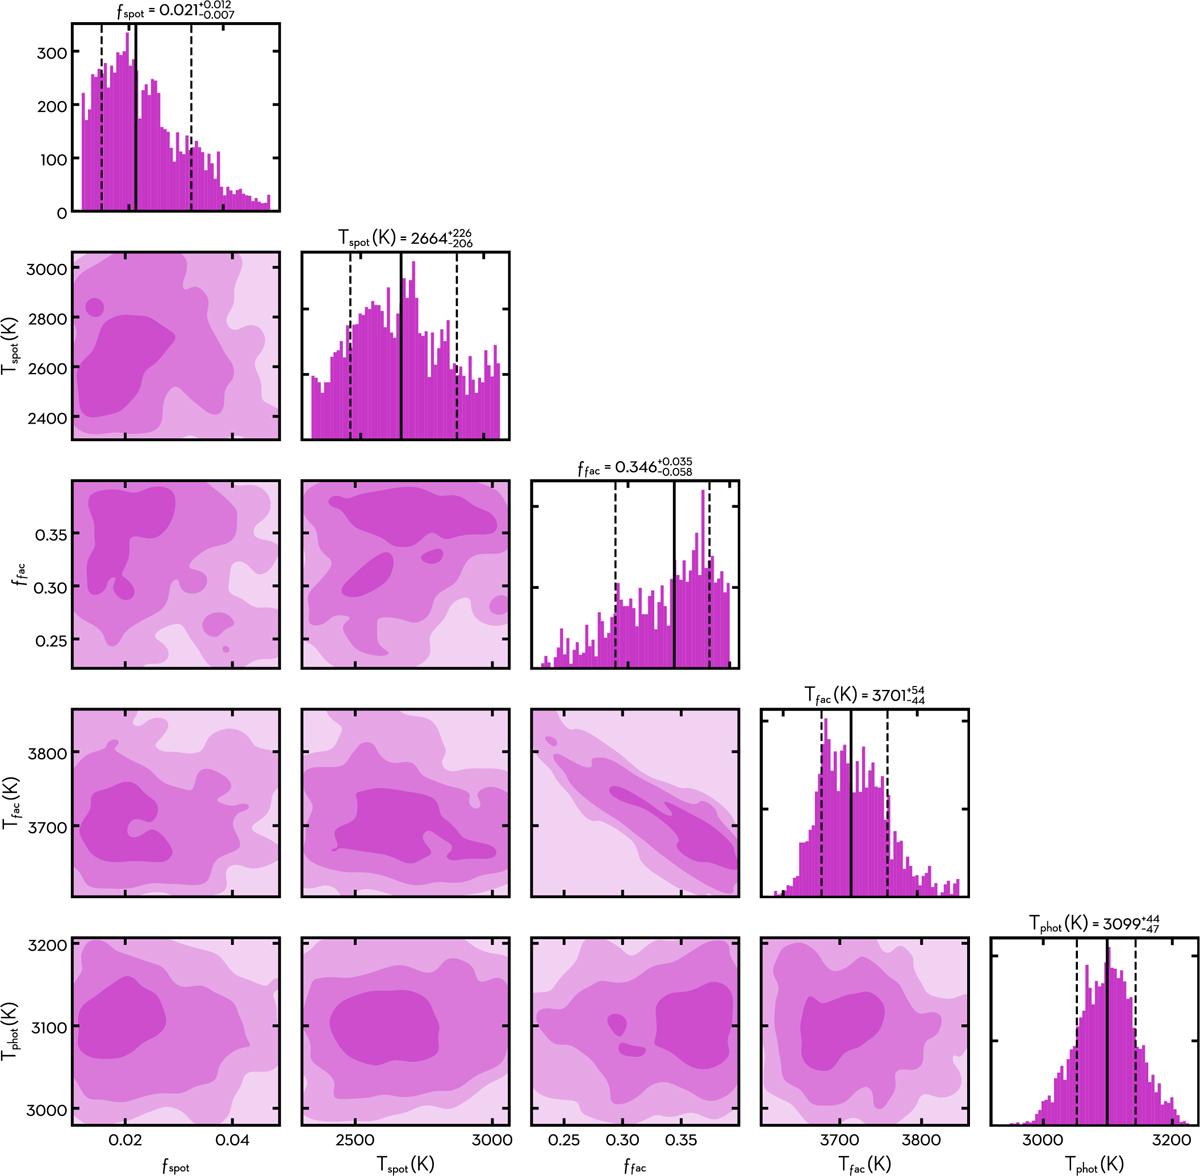
Fig. A.3
Download original image
Posterior distributions for the stellar-contamination parameters of LHS 1140 b from the ECLIPSE-Xλ fit with limb darkening included. The panels show the 1D and 2D marginals for the spot filling factor (fspot), spot temperature (Tspot), facula filling factor (ffac), facula temperature (Tfac), and photospheric temperature (Tphot). Diagonal panels display the 1D histograms with the median and 16th–84th percentile intervals marked by solid and dashed vertical lines, respectively. Off-diagonal panels show the corresponding 2D credible regions, with darker shades indicating higher posterior density. Numerical summaries of these posteriors are reported in Table 2.
Current usage metrics show cumulative count of Article Views (full-text article views including HTML views, PDF and ePub downloads, according to the available data) and Abstracts Views on Vision4Press platform.
Data correspond to usage on the plateform after 2015. The current usage metrics is available 48-96 hours after online publication and is updated daily on week days.
Initial download of the metrics may take a while.