Open Access
Fig. 1
Download original image
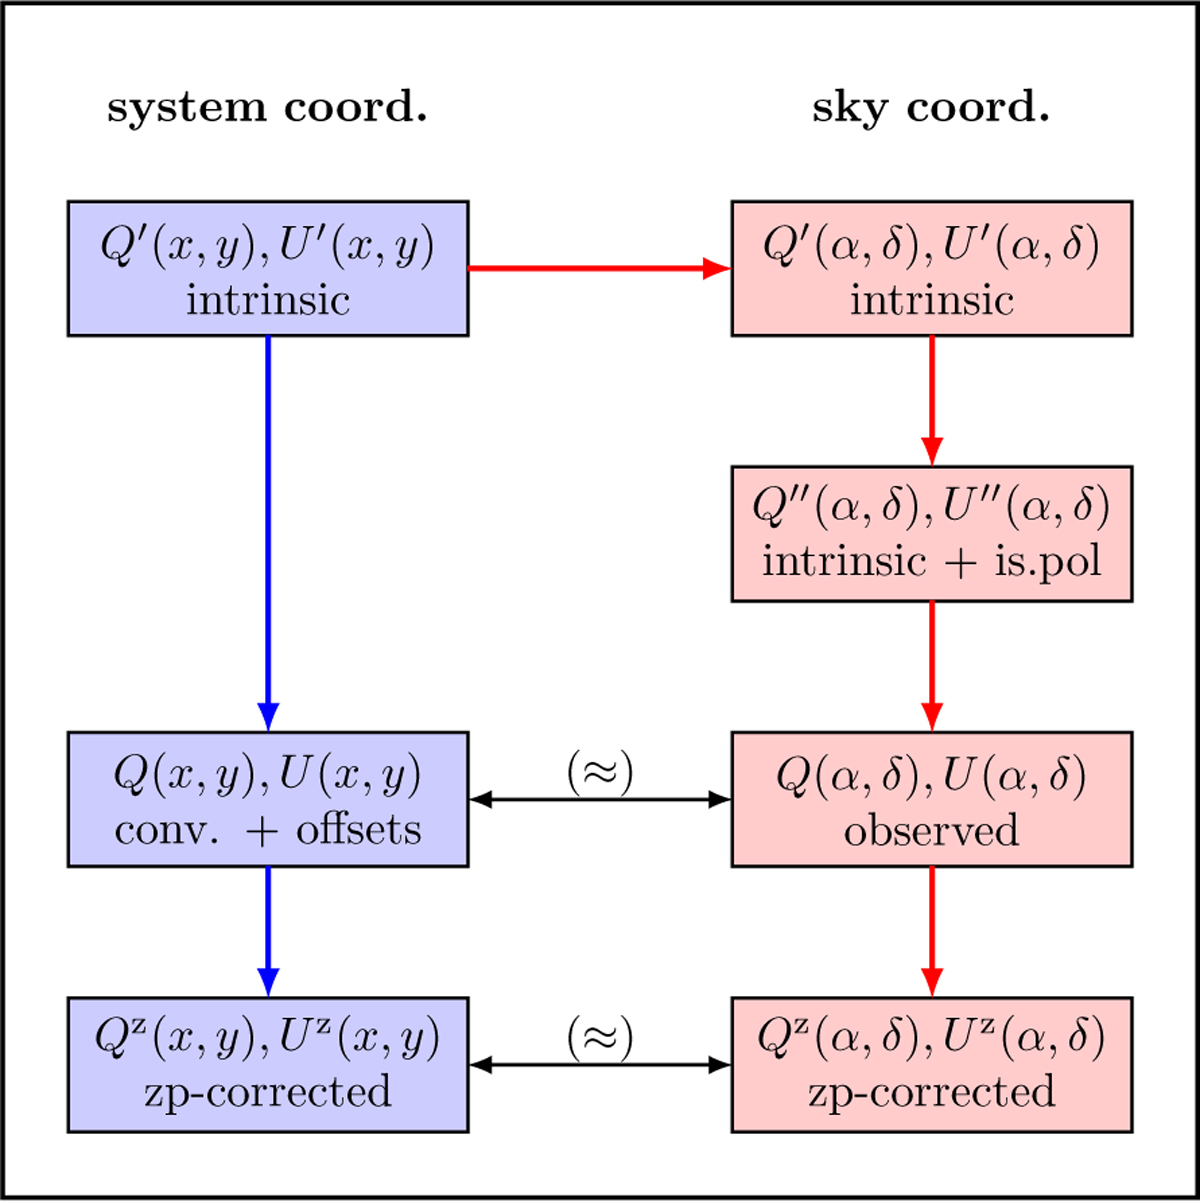
Block diagram with the simplified description of the simulated imaging polarimetry given in blue. The red arrows show the full imaging process from the intrinsic model to the on-sky model including interstellar polarization to the observed and possibly zp-corrected polarization signal.
Current usage metrics show cumulative count of Article Views (full-text article views including HTML views, PDF and ePub downloads, according to the available data) and Abstracts Views on Vision4Press platform.
Data correspond to usage on the plateform after 2015. The current usage metrics is available 48-96 hours after online publication and is updated daily on week days.
Initial download of the metrics may take a while.