Fig. 20
Download original image
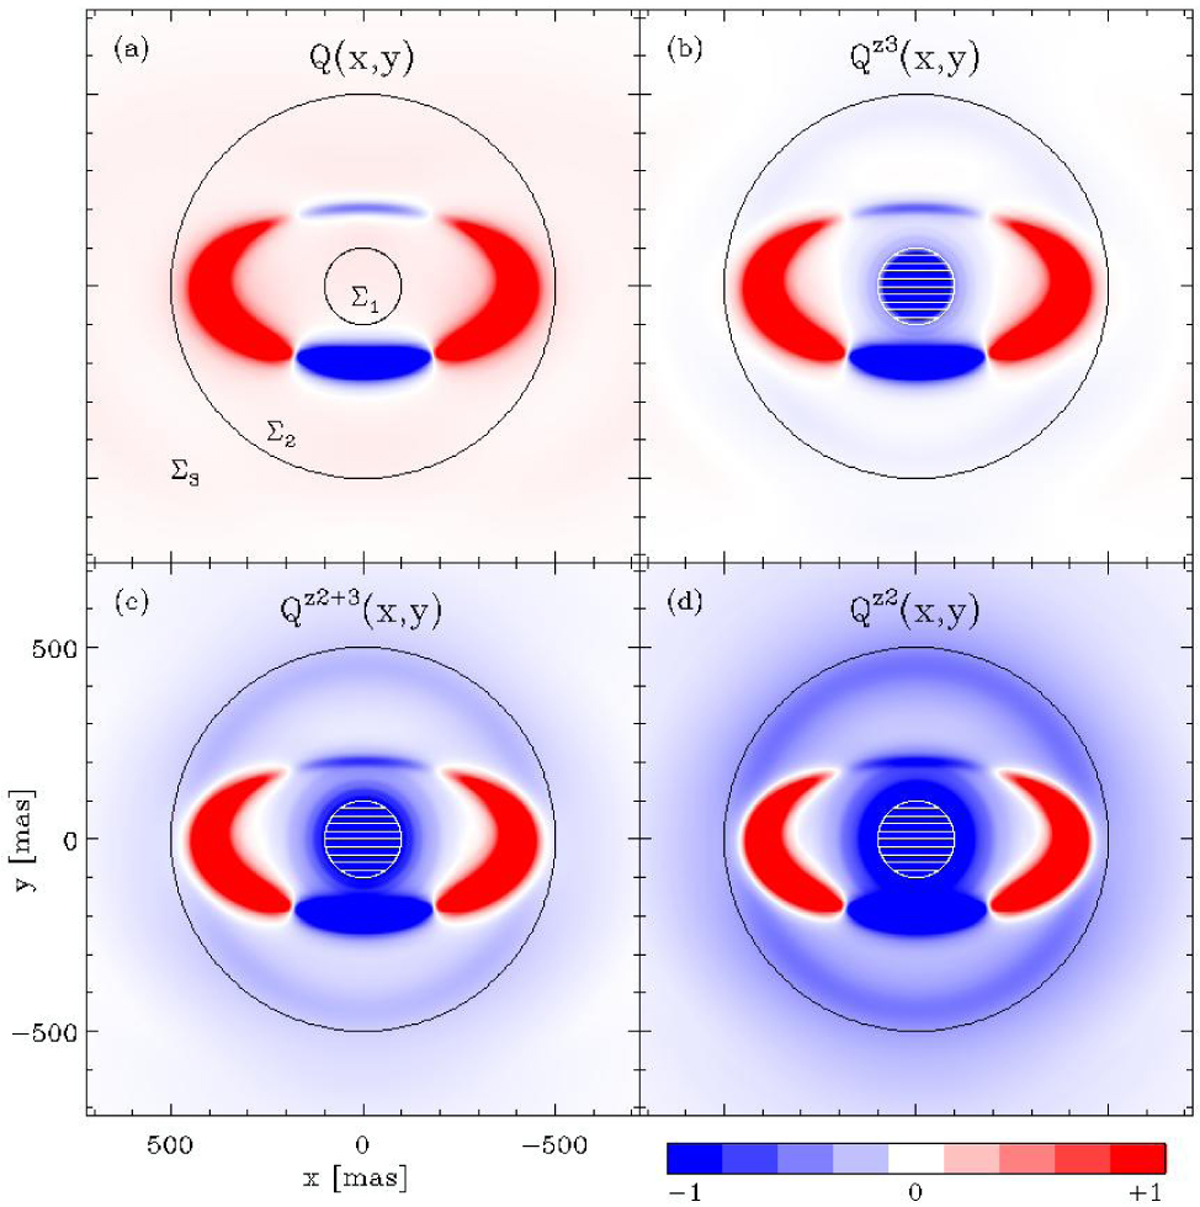
Effects of the zp-correction for Stokes Q for the PSFAO convolved RingI60 model with r0 = 403.2 mas for observations with a coronagraphic mask, indicated by the central hatched area. Panel a shows the convolved signal Q(x, y), b shows the map after a correction based on the halo Qz3, c shows the map after correction based on the disk plus halo Qz2+3, and d shows the map after correction based on the disk region Qz2. The peak Q signal is in all panels between 22 and 23 units with respect to the indicated color scale.
Current usage metrics show cumulative count of Article Views (full-text article views including HTML views, PDF and ePub downloads, according to the available data) and Abstracts Views on Vision4Press platform.
Data correspond to usage on the plateform after 2015. The current usage metrics is available 48-96 hours after online publication and is updated daily on week days.
Initial download of the metrics may take a while.