Fig. 1
Download original image
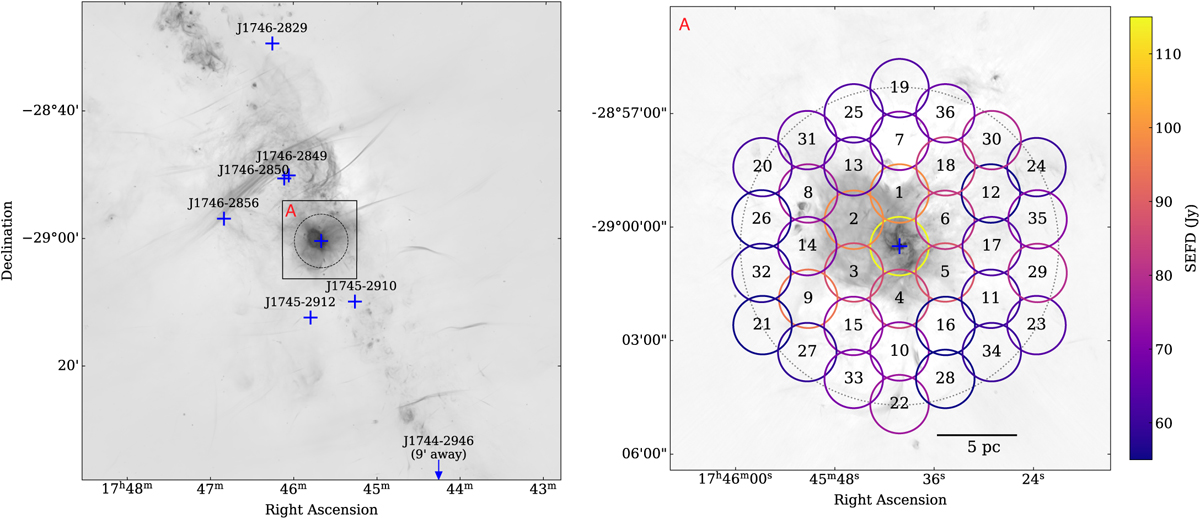
Left panel: image of the GC region produced by MeerKAT at 1.28 GHz (Heywood et al. 2022) with the positions of the known pulsars indicated by blue crosses (or a blue arrow in the case of the recently discovered millisecond pulsar J1744−2946, 9′ away from the edge of the map). The region delineated by the square box marked with the letter A is displayed in the right hand panel. The dashed grey circle delimits the 10 pc region around Sgr A∗ at the distance of the GC. Right panel: observing grid superimposed on a radio map of the GC obtained at 5.5 GHz with the Very Large Array (Zhao et al. 2016). Each coloured circle with the pointing number at its center represents the beam size at HPBW at 8 GHz θ8GHz = 1.55′ with the color corresponding to the pointing System Equivalent Flux Density (SEFD) value shown with the vertical colour bar. The blue cross at the center of the dotted circle indicate the location of the magnetar SGR J1745−2900. For clarity, we omit the numerical label of the inner pointing centred on Sgr A∗. The dotted grey circle delimits the 10 pc region around Sgr A*.
Current usage metrics show cumulative count of Article Views (full-text article views including HTML views, PDF and ePub downloads, according to the available data) and Abstracts Views on Vision4Press platform.
Data correspond to usage on the plateform after 2015. The current usage metrics is available 48-96 hours after online publication and is updated daily on week days.
Initial download of the metrics may take a while.