Fig. 3
Download original image
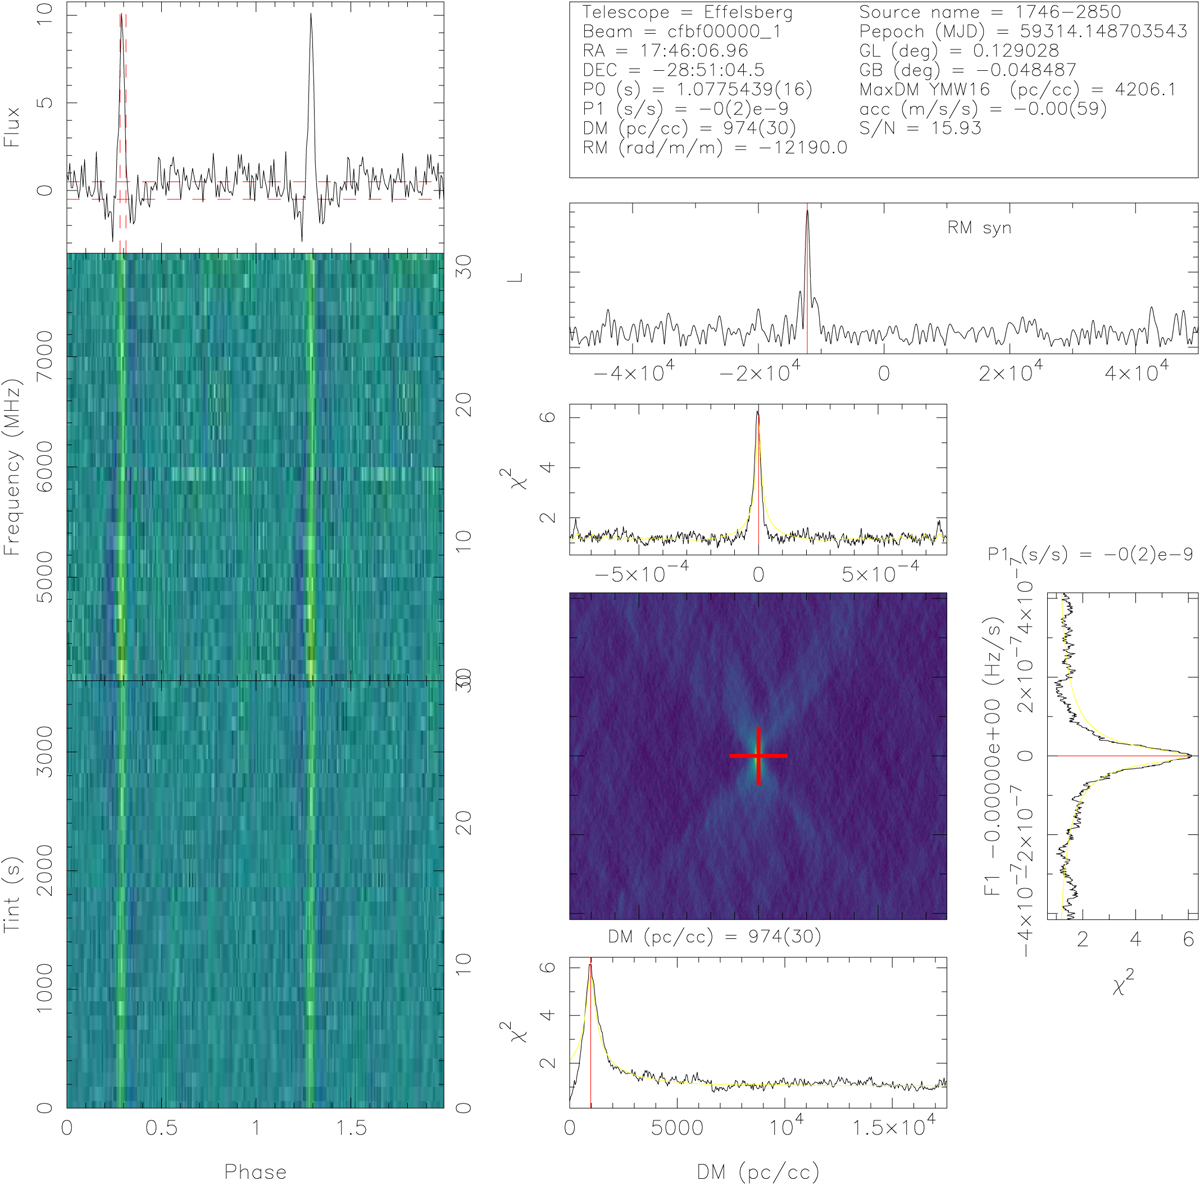
Detection plot of the pulsar J1746−2850 produced by PulsarX. In addition to the panels described in Men et al. (2023), a new additional panel (a) shows the results of the RM synthesis analysis of the pulse delimited by the two vertical dashed lines of panel (b) for an evenly spaced grid of RM comprised between –50 000 rad m−2 and +50 000 rad m−2 with an RM step of 5 rad m−2.
Current usage metrics show cumulative count of Article Views (full-text article views including HTML views, PDF and ePub downloads, according to the available data) and Abstracts Views on Vision4Press platform.
Data correspond to usage on the plateform after 2015. The current usage metrics is available 48-96 hours after online publication and is updated daily on week days.
Initial download of the metrics may take a while.