Fig. 4
Download original image
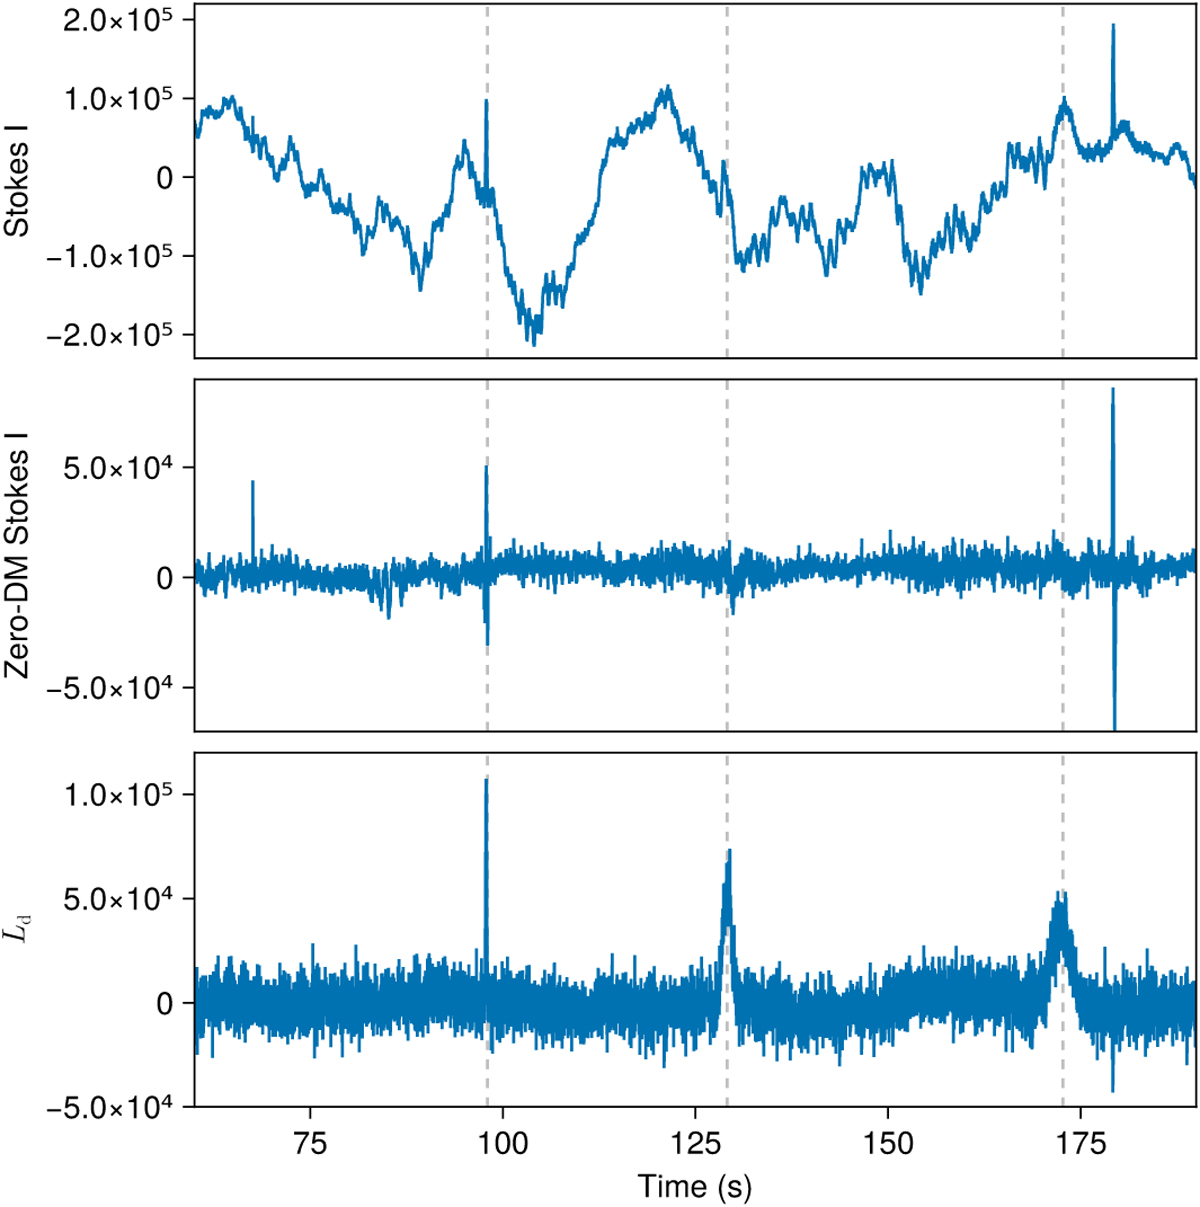
Top panel: an excerpt of the total intensity (Stokes I) time series dedispersed at the DM of the injected pulses and exhibiting large amount of red noise. Middle panel: a view of the Stokes I time series dedispersed at the DM of the injected pulses and after subtraction of the zero DM time series. Bottom panel: time series of the linear polarisation Ld after dedispersion and the correction of Faraday rotation at RM = 10 000 rad m−2. For clarity, the average value of Ld has been subtracted from it. In all three panels, the grey dashed lines indicate the location of the three injected pulses.
Current usage metrics show cumulative count of Article Views (full-text article views including HTML views, PDF and ePub downloads, according to the available data) and Abstracts Views on Vision4Press platform.
Data correspond to usage on the plateform after 2015. The current usage metrics is available 48-96 hours after online publication and is updated daily on week days.
Initial download of the metrics may take a while.