Open Access
Fig. 5
Download original image
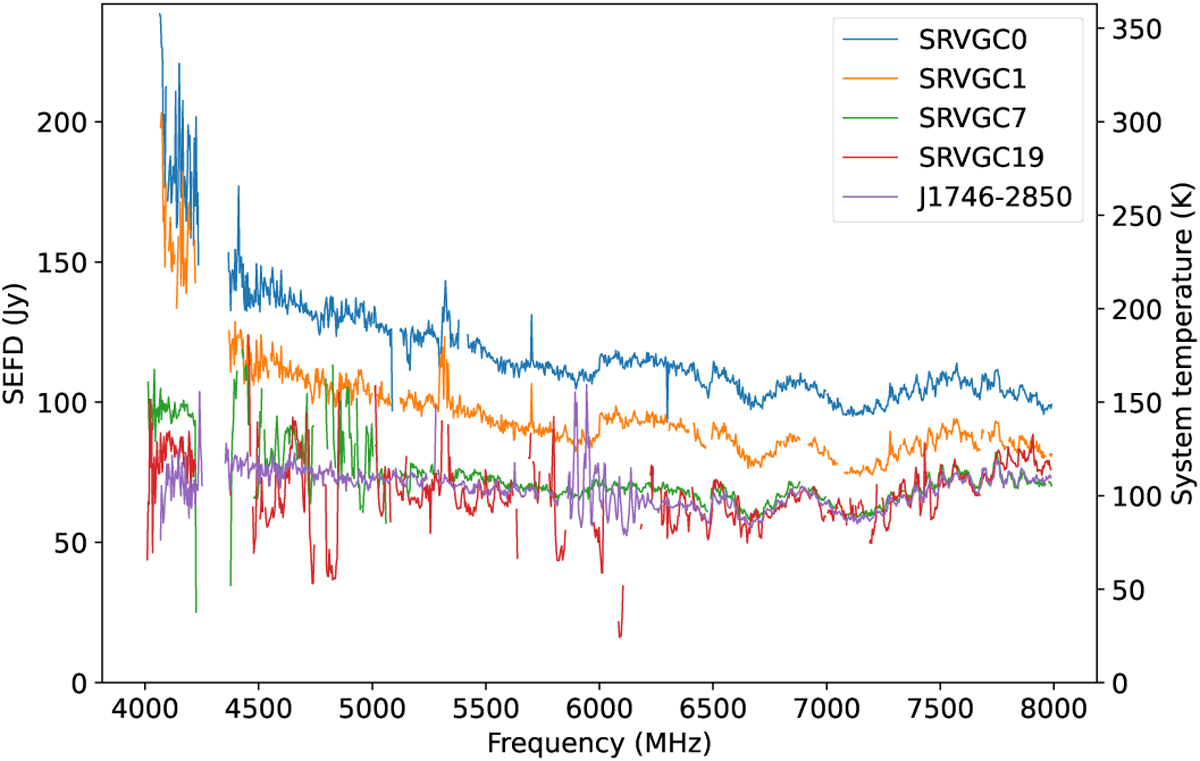
Measured SEFD and Tsys as a function of observing frequency for a set of 4 survey pointings, from inner to outer rings (see Fig. 1). For comparison, we also added the SEFD measured at the sky location of PSR J1746–2850. The discontinuities in the SEFD curves are due to zapped frequency channels.
Current usage metrics show cumulative count of Article Views (full-text article views including HTML views, PDF and ePub downloads, according to the available data) and Abstracts Views on Vision4Press platform.
Data correspond to usage on the plateform after 2015. The current usage metrics is available 48-96 hours after online publication and is updated daily on week days.
Initial download of the metrics may take a while.