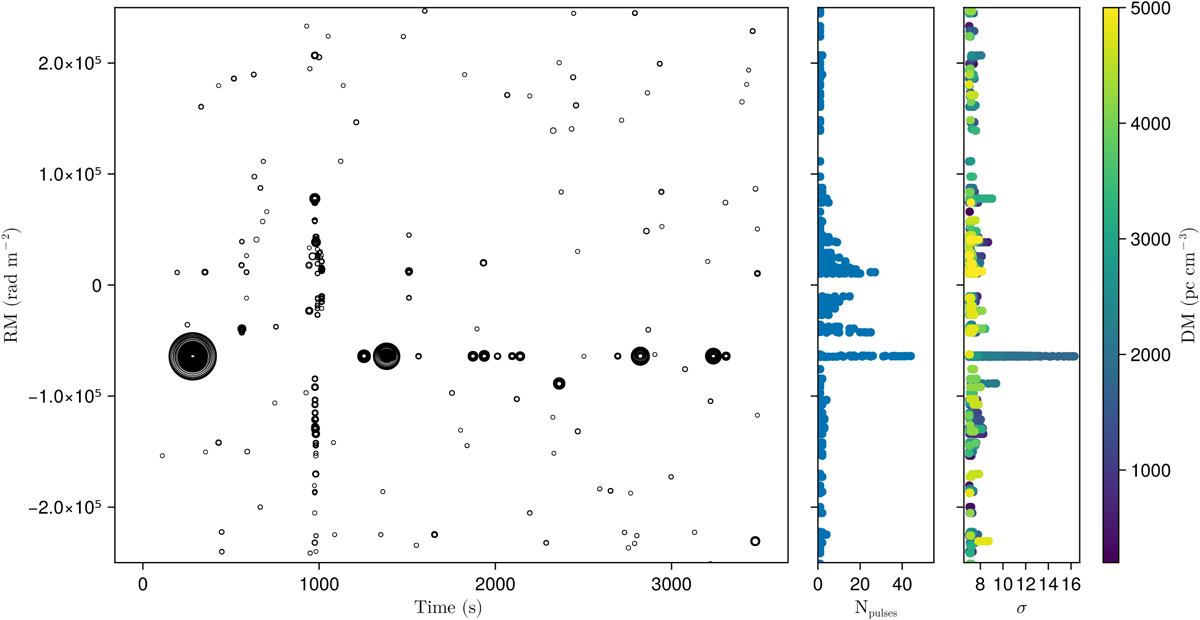
Fig. 9
Download original image
Summary plot of the linear polarisation search. The left panel shows the RM of the single pulse candidates versus time with the size of the open circle marker indicating larger S/N (σ) with larger marker. The middle panel shows the number of single pulse detection per bin of RM. The panel on the right shows σ of the burst as function of its RM with a color scale corresponding to the detection DM. For clarity, the RM-range (y-axis) shown on all panels is restricted to −250 000; +250 000 rad m−2. As described in Section 3.2, candidates with |RM| <10 000 rad m−2 are excised. The detection of several bright pulses at DM of 1800 pc cm−3 and peaking at RM=−66 000 rad m−2 correspond to single pulses emitted by the SGR J1745−2900.
Current usage metrics show cumulative count of Article Views (full-text article views including HTML views, PDF and ePub downloads, according to the available data) and Abstracts Views on Vision4Press platform.
Data correspond to usage on the plateform after 2015. The current usage metrics is available 48-96 hours after online publication and is updated daily on week days.
Initial download of the metrics may take a while.