Fig. 12.
Download original image
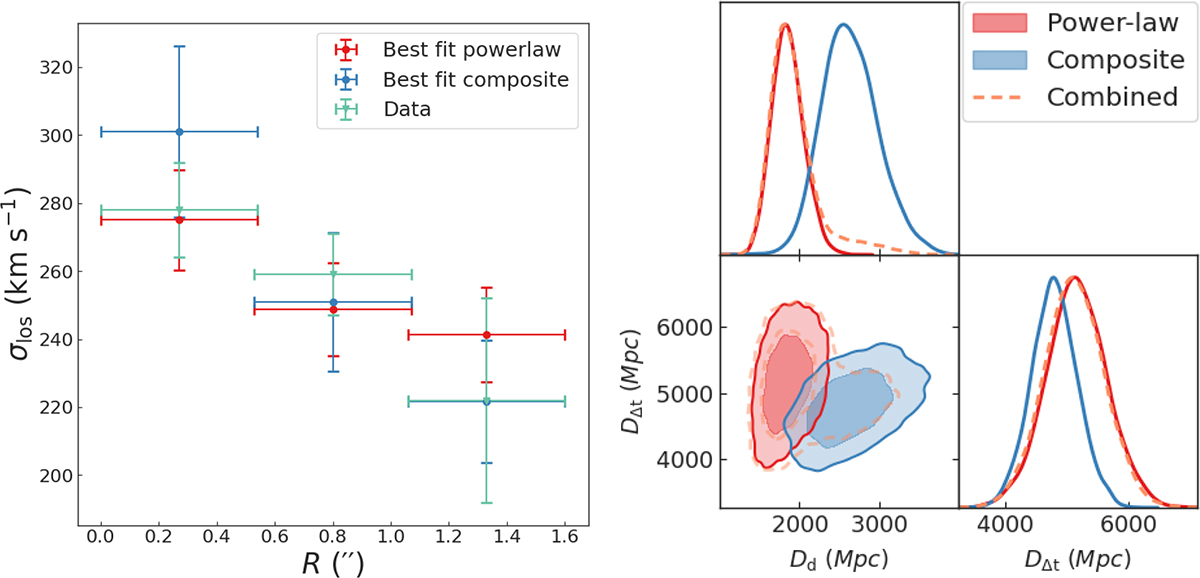
Left panel: Kinematic fit using power-law and composite models. Red and blue central dots show the best-fit values, while error bars are the 16th and 84th percentiles of 100 predicted velocity dispersions. Right panel: Posterior of Dd and DΔt using kinematics based on the power-law and composite mass models. Using likelihood weighting we measured ![]() Mpc and
Mpc and ![]() Mpc.
Mpc.
Current usage metrics show cumulative count of Article Views (full-text article views including HTML views, PDF and ePub downloads, according to the available data) and Abstracts Views on Vision4Press platform.
Data correspond to usage on the plateform after 2015. The current usage metrics is available 48-96 hours after online publication and is updated daily on week days.
Initial download of the metrics may take a while.