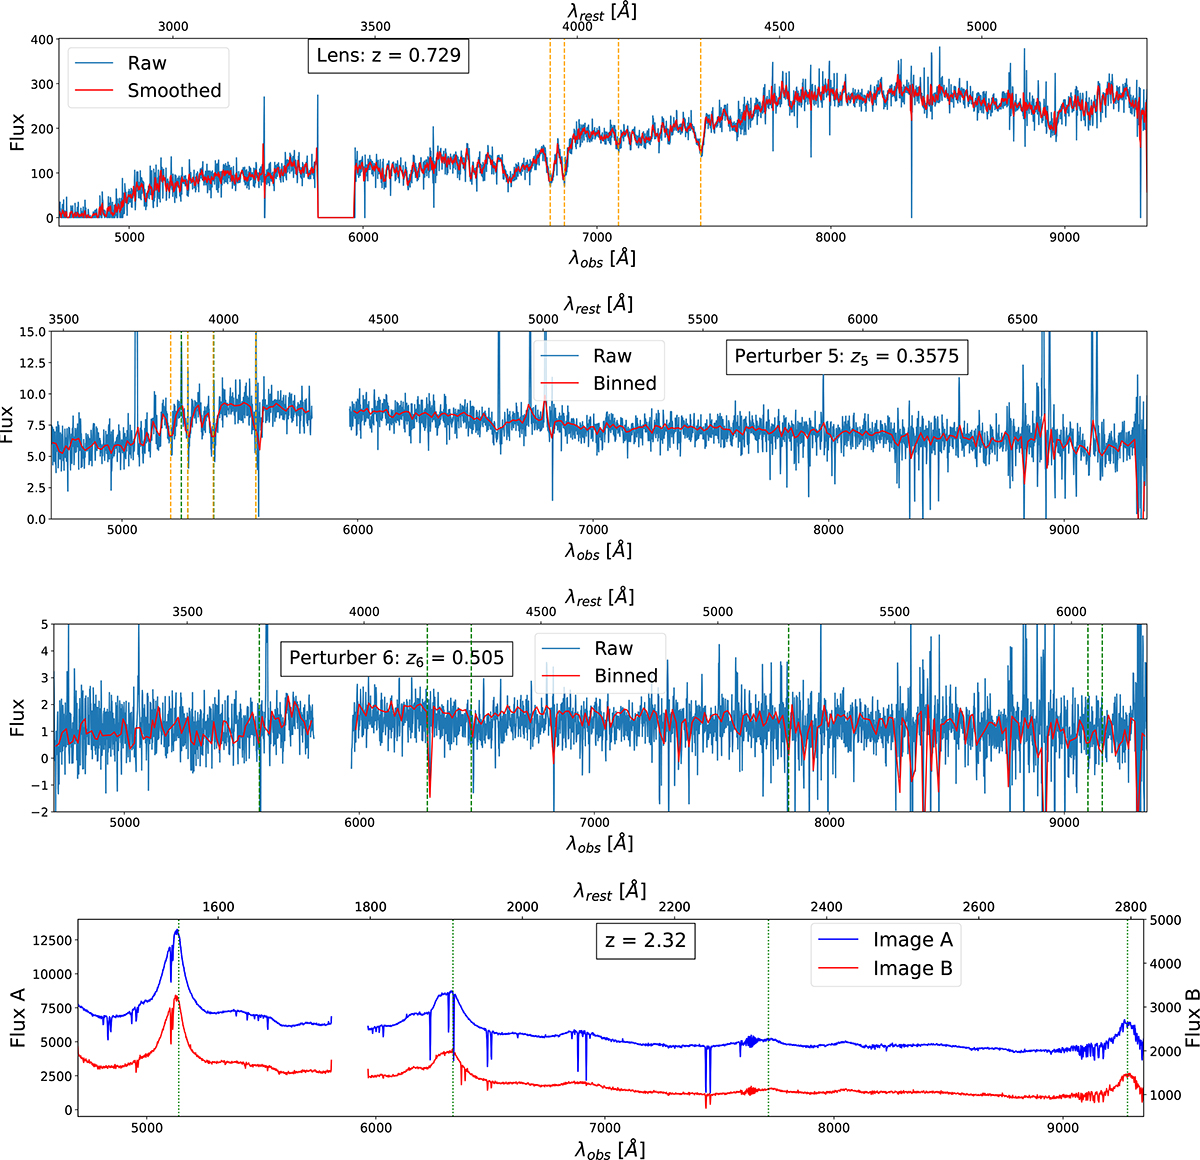
Fig. B.1.
Download original image
Integrated spectra from the MUSE data cube with apertures shown in Fig. 4. The binned flux is computed by imposing a minimal S/N of 5 per wavelength bin. From top to bottom, Lens centre: from left to right, the stellar absorption lines CaH, CaK, H[[INLINE557]], and G-band (orange dashed lines) are consistent with the previously determined zd = 0.729. P5: from left to right, the galactic emission lines Ne III, He I, H[[INLINE559]], and H[[INLINE560]] are highlighted with green dashed lines and allowed us to measure z5 = 0.3575. We also identify the stellar absorption lines H[[INLINE562]], HEI, CaH, and CaK allowing a velocity dispersion measurement. P6: from left to right the lines Mg I, Ca II O II, H[[INLINE563]], and O III doublet allowed us to measure z6 = 0.505. Quasar images: from left to right, we recognise the C IV, C III, C II, and Mg II emission lines.
Current usage metrics show cumulative count of Article Views (full-text article views including HTML views, PDF and ePub downloads, according to the available data) and Abstracts Views on Vision4Press platform.
Data correspond to usage on the plateform after 2015. The current usage metrics is available 48-96 hours after online publication and is updated daily on week days.
Initial download of the metrics may take a while.