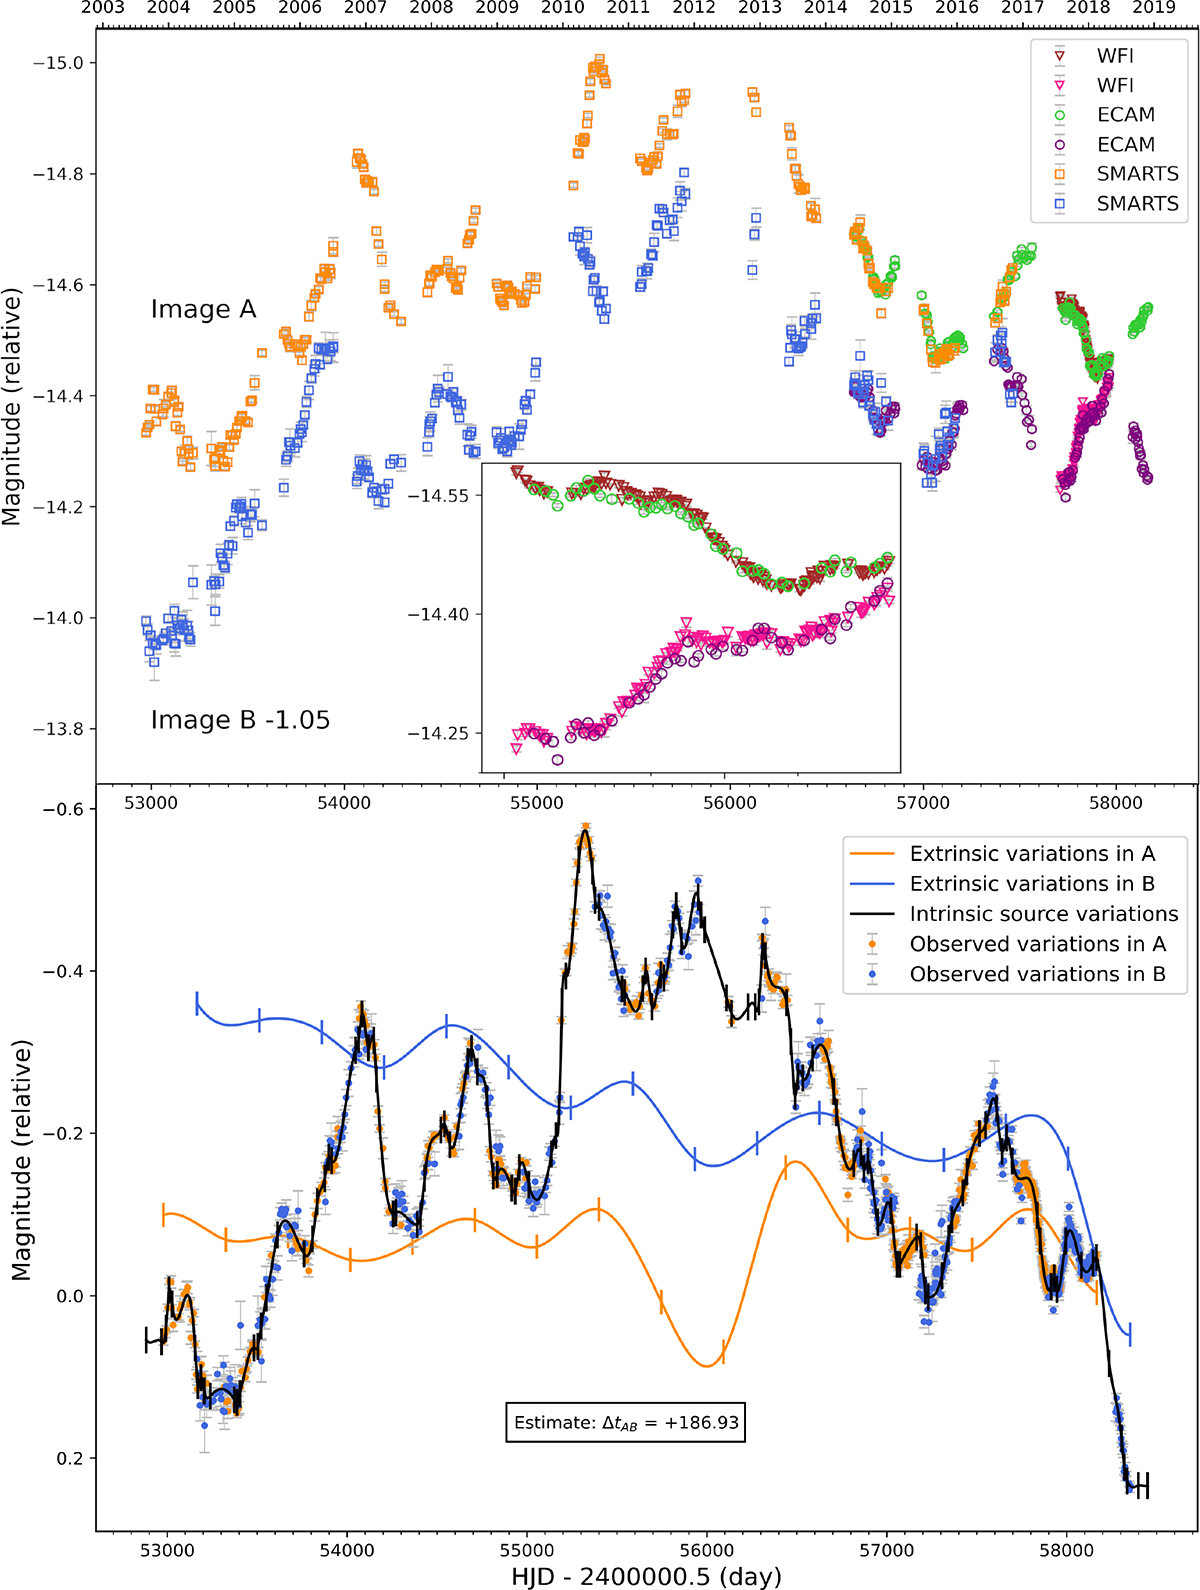
Fig. 2.
Download original image
Top panel: HE 1104−1805 R-band light curve obtained by joining three datasets: SMARTS (yellow and blue squares), ECAM (purple and green circles), and WFI (brown and pink triangles). For clarity, the light curve of B was shifted by –1.05 mag. The inset zooms on the WFI dataset span, showcasing its superior sampling to the ECAM dataset. Bottom panel: Example of a simultaneous fit of an intrinsic light curve with η = 45 days and nml = 15. The time shift obtained by this fit gives a point estimate of the system’s time delay. By repeating such measurements with randomised starting points 800 times, we obtained the time-delay measurement of this (η, nml) configuration.
Current usage metrics show cumulative count of Article Views (full-text article views including HTML views, PDF and ePub downloads, according to the available data) and Abstracts Views on Vision4Press platform.
Data correspond to usage on the plateform after 2015. The current usage metrics is available 48-96 hours after online publication and is updated daily on week days.
Initial download of the metrics may take a while.