Open Access
Fig. 4.
Download original image
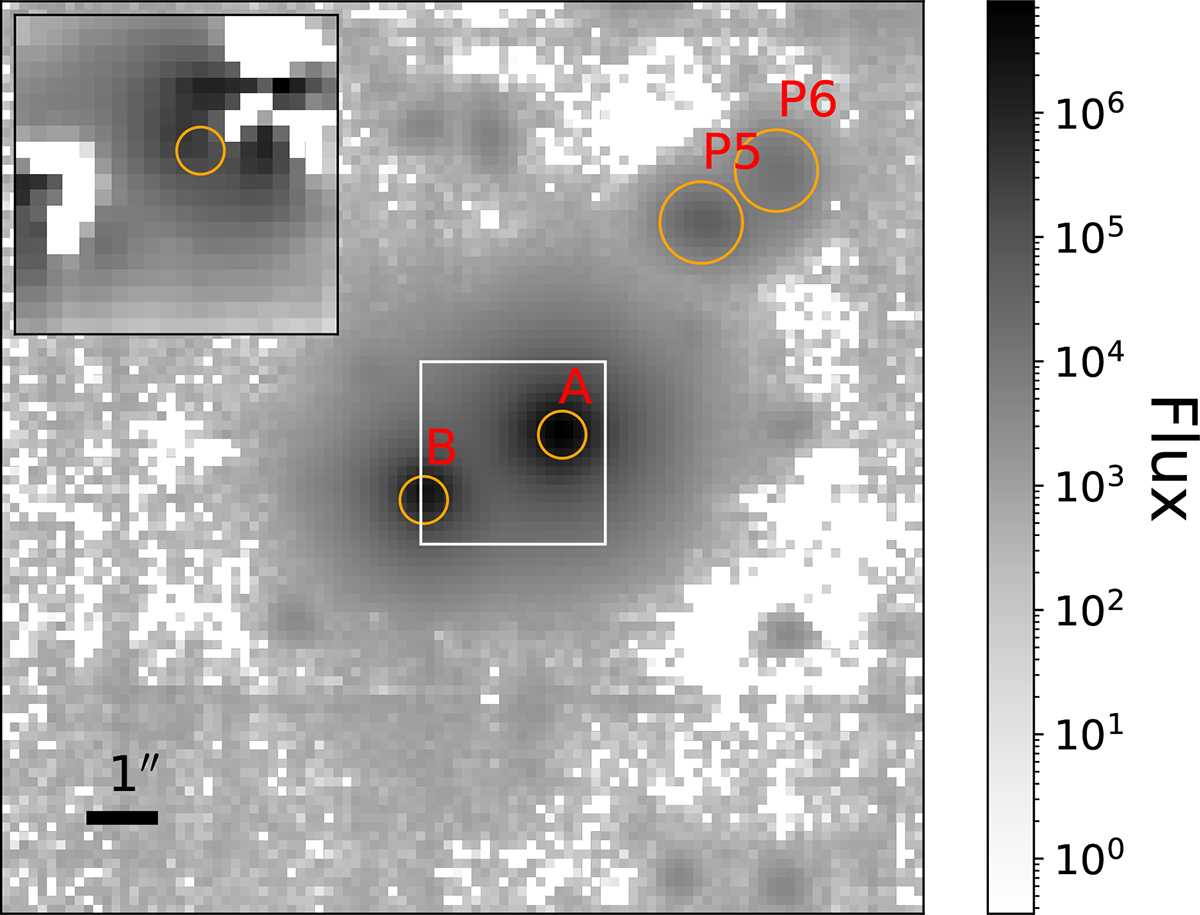
MUSE data cube summed over all wavelengths. The inset displays the point-source subtracted cube, revealing the lens galaxy light. The apertures used to extract individual spectra of the quasar images, lens centre, and perturbers shown in Fig. B.1 are represented by orange circles.
Current usage metrics show cumulative count of Article Views (full-text article views including HTML views, PDF and ePub downloads, according to the available data) and Abstracts Views on Vision4Press platform.
Data correspond to usage on the plateform after 2015. The current usage metrics is available 48-96 hours after online publication and is updated daily on week days.
Initial download of the metrics may take a while.