Fig. 11.
Download original image
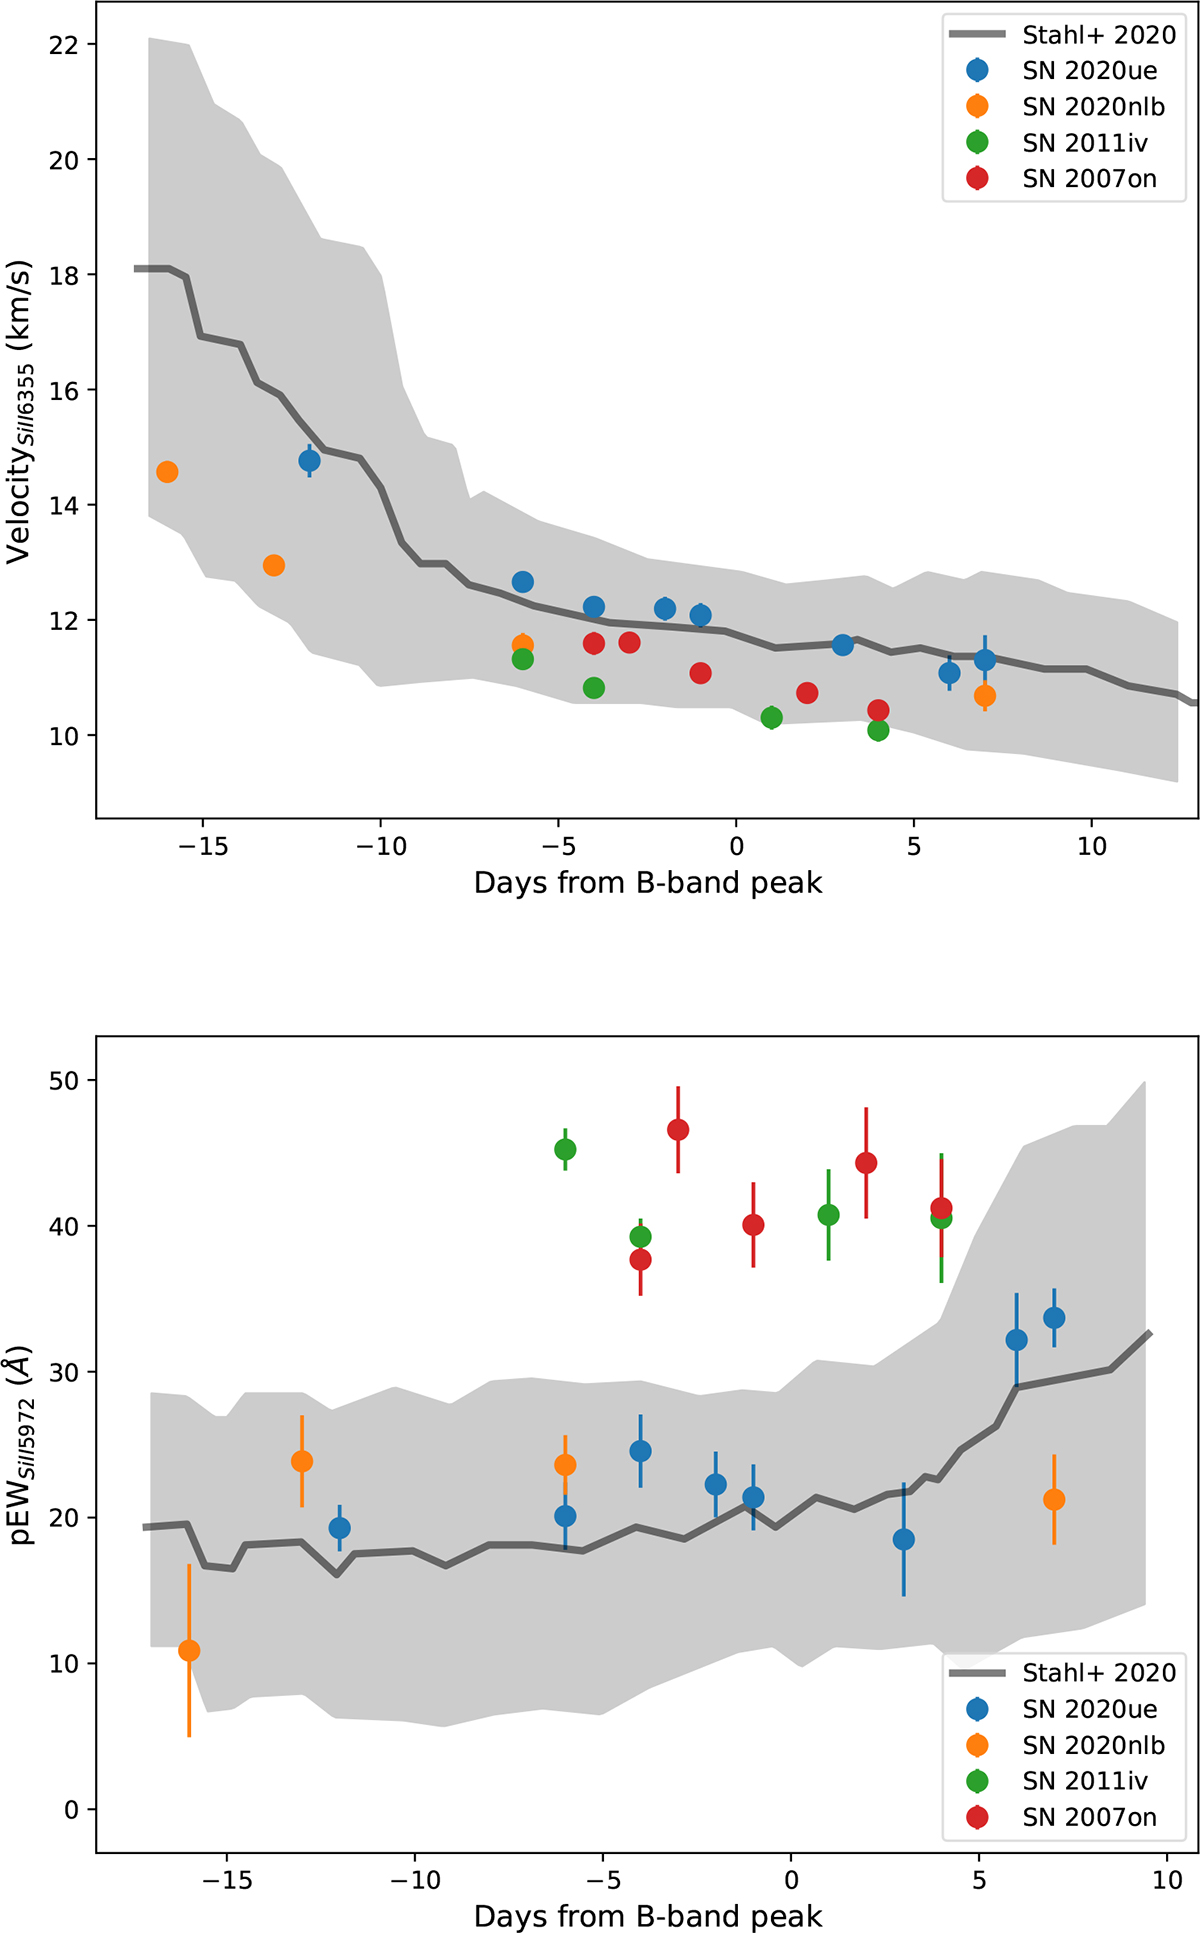
Upper panel: Blueshifted velocity evolution inferred using spextractor on early spectra of SN 2020ue (blue), SN 2020nlb (orange), as well as transitional SNe SN 2011iv (green) and SN 2007on (red). The grey line and shaded region represent the average trend from the 247 SN sample in Stahl et al. (2020), analysed using the same method. Lower panel: Evolution of the pEW of the Si II 5972 Å line compared to the average trend reported in Stahl et al. (2020).
Current usage metrics show cumulative count of Article Views (full-text article views including HTML views, PDF and ePub downloads, according to the available data) and Abstracts Views on Vision4Press platform.
Data correspond to usage on the plateform after 2015. The current usage metrics is available 48-96 hours after online publication and is updated daily on week days.
Initial download of the metrics may take a while.