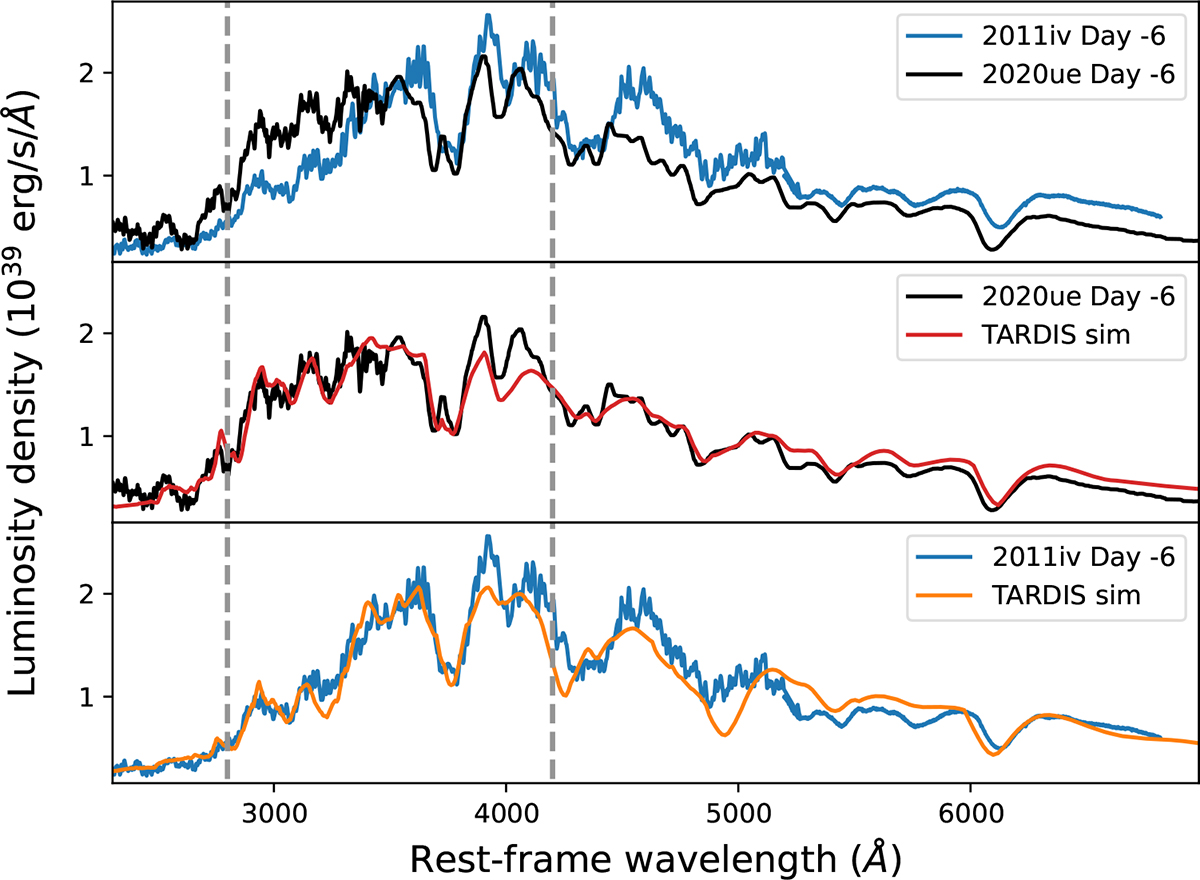
Fig. 12.
Download original image
Spectral modelling and comparison between SN 2020ue and SN 2011iv. Top panel: UV and optical spectra observed at a similar epoch (about six days before peak brightness) for SN 2020ue (black) and SN 2011iv (blue, Gall et al. 2018). Middle panel: Results from the TARDIS simulations (red curve) for the spectrum of SN 2020ue (black). Lower panel: Results from the TARDIS simulations (orange curve) for the SN 20211iv spectrum (black). The region between the two dashed grey lines corresponds to the wavelength range considered for the minimisation of the root-mean-square value (see Sect. 4).
Current usage metrics show cumulative count of Article Views (full-text article views including HTML views, PDF and ePub downloads, according to the available data) and Abstracts Views on Vision4Press platform.
Data correspond to usage on the plateform after 2015. The current usage metrics is available 48-96 hours after online publication and is updated daily on week days.
Initial download of the metrics may take a while.