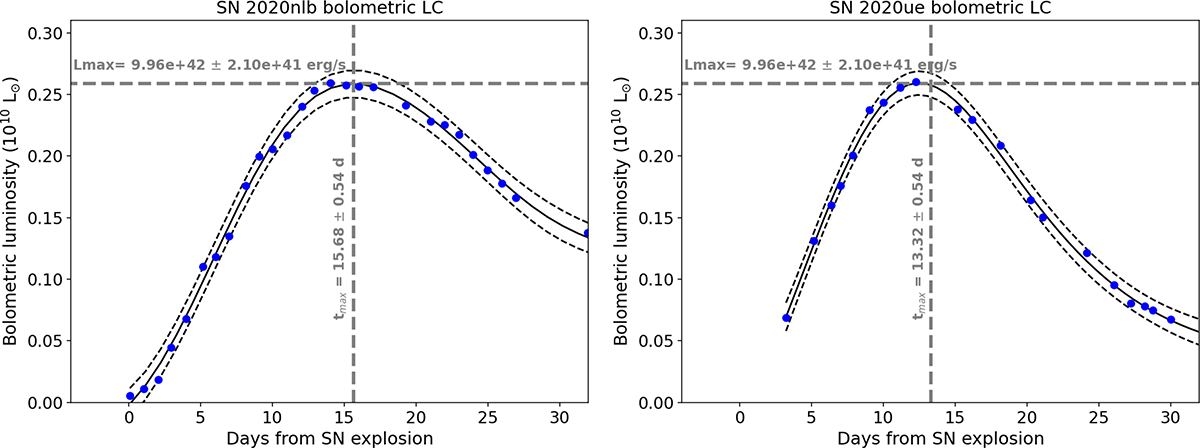
Fig. B.2.
Download original image
Bolometric light curves of SN 2020nlb (left panel) and SN 2020ue (right panel). The black curves represent the GP model employed to estimate the peak luminosity and epoch of each light curve. The determined epochs for the SN explosions correspond to those obtained using the photospheric velocity method proposed by Piro & Nakar (2014).
Current usage metrics show cumulative count of Article Views (full-text article views including HTML views, PDF and ePub downloads, according to the available data) and Abstracts Views on Vision4Press platform.
Data correspond to usage on the plateform after 2015. The current usage metrics is available 48-96 hours after online publication and is updated daily on week days.
Initial download of the metrics may take a while.