Open Access
Fig. B.3.
Download original image
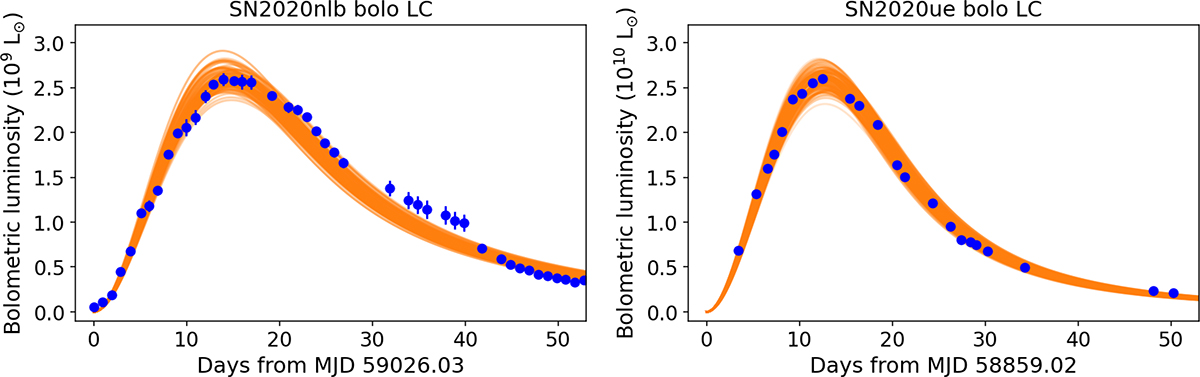
Fit of the SN 2020nlb (left panel) and SN 2020ue (right panel) bolometric light curves. The orange curves correspond to 200 samples from the posterior distributions of the best-fit results shown in Table 3.
Current usage metrics show cumulative count of Article Views (full-text article views including HTML views, PDF and ePub downloads, according to the available data) and Abstracts Views on Vision4Press platform.
Data correspond to usage on the plateform after 2015. The current usage metrics is available 48-96 hours after online publication and is updated daily on week days.
Initial download of the metrics may take a while.