Open Access
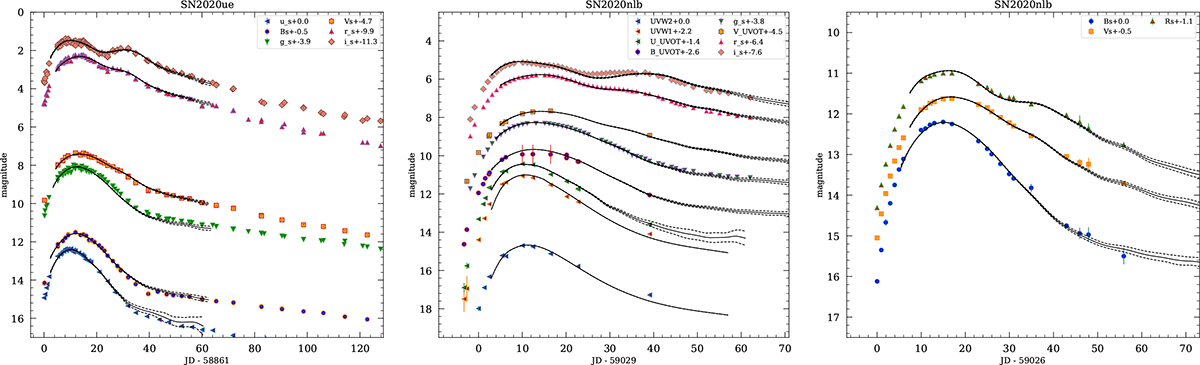
Fig. B.6.
Download original image
Fit obtained with SNOOPY (black curves) using LCO data (uBVgri) for SN 2020ue (left panel), and using Thacher (gri) and UVOT data for SN 2020nlb (middle panel), and OASDG data (BVR, right panel). The plot shows the results obtained using the max-model light curve model function and the sBV stretch-colour parameter.
Current usage metrics show cumulative count of Article Views (full-text article views including HTML views, PDF and ePub downloads, according to the available data) and Abstracts Views on Vision4Press platform.
Data correspond to usage on the plateform after 2015. The current usage metrics is available 48-96 hours after online publication and is updated daily on week days.
Initial download of the metrics may take a while.