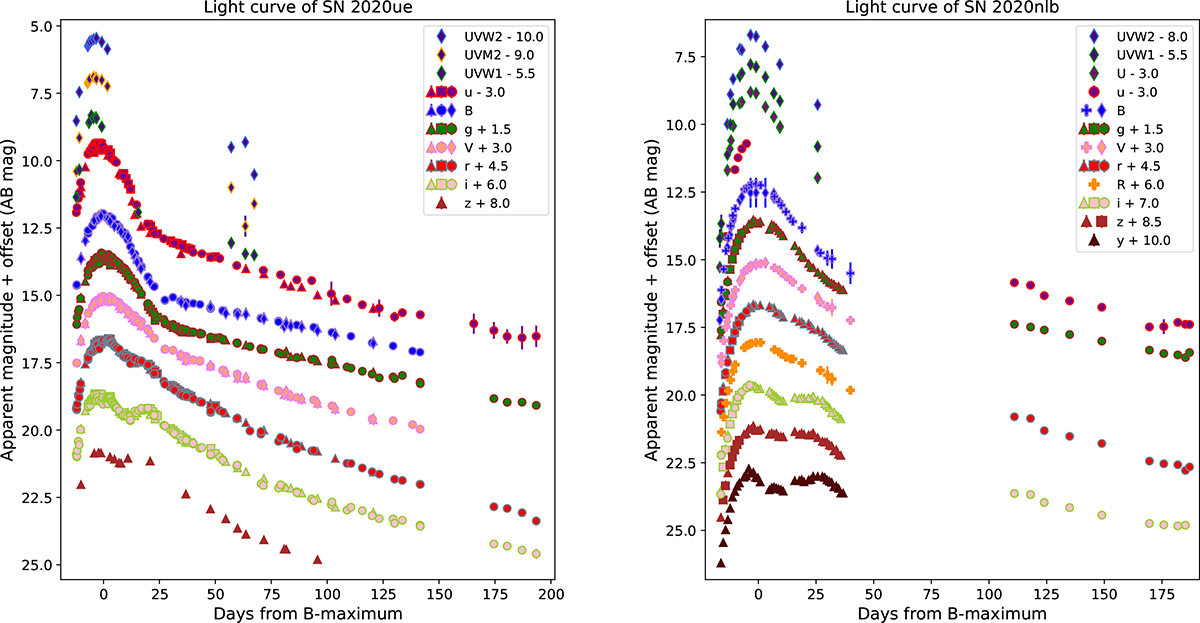
Fig. 2.
Download original image
Light curve evolution of SN 2020ue (left panel) and SN 2020nlb (right panel). Symbols denote data from different facilities (diamonds: Swift-UVOT; triangles: Copernico-AFOSC, NOT-ALFOSC (for SN 2020ue), and Pan-STARRS (for SN 2020nlb); squares: Swope and Thacher; circles: LCO; pluses: OASDG), with colours indicating filters. Both light curves have not been corrected for Galactic reddening.
Current usage metrics show cumulative count of Article Views (full-text article views including HTML views, PDF and ePub downloads, according to the available data) and Abstracts Views on Vision4Press platform.
Data correspond to usage on the plateform after 2015. The current usage metrics is available 48-96 hours after online publication and is updated daily on week days.
Initial download of the metrics may take a while.