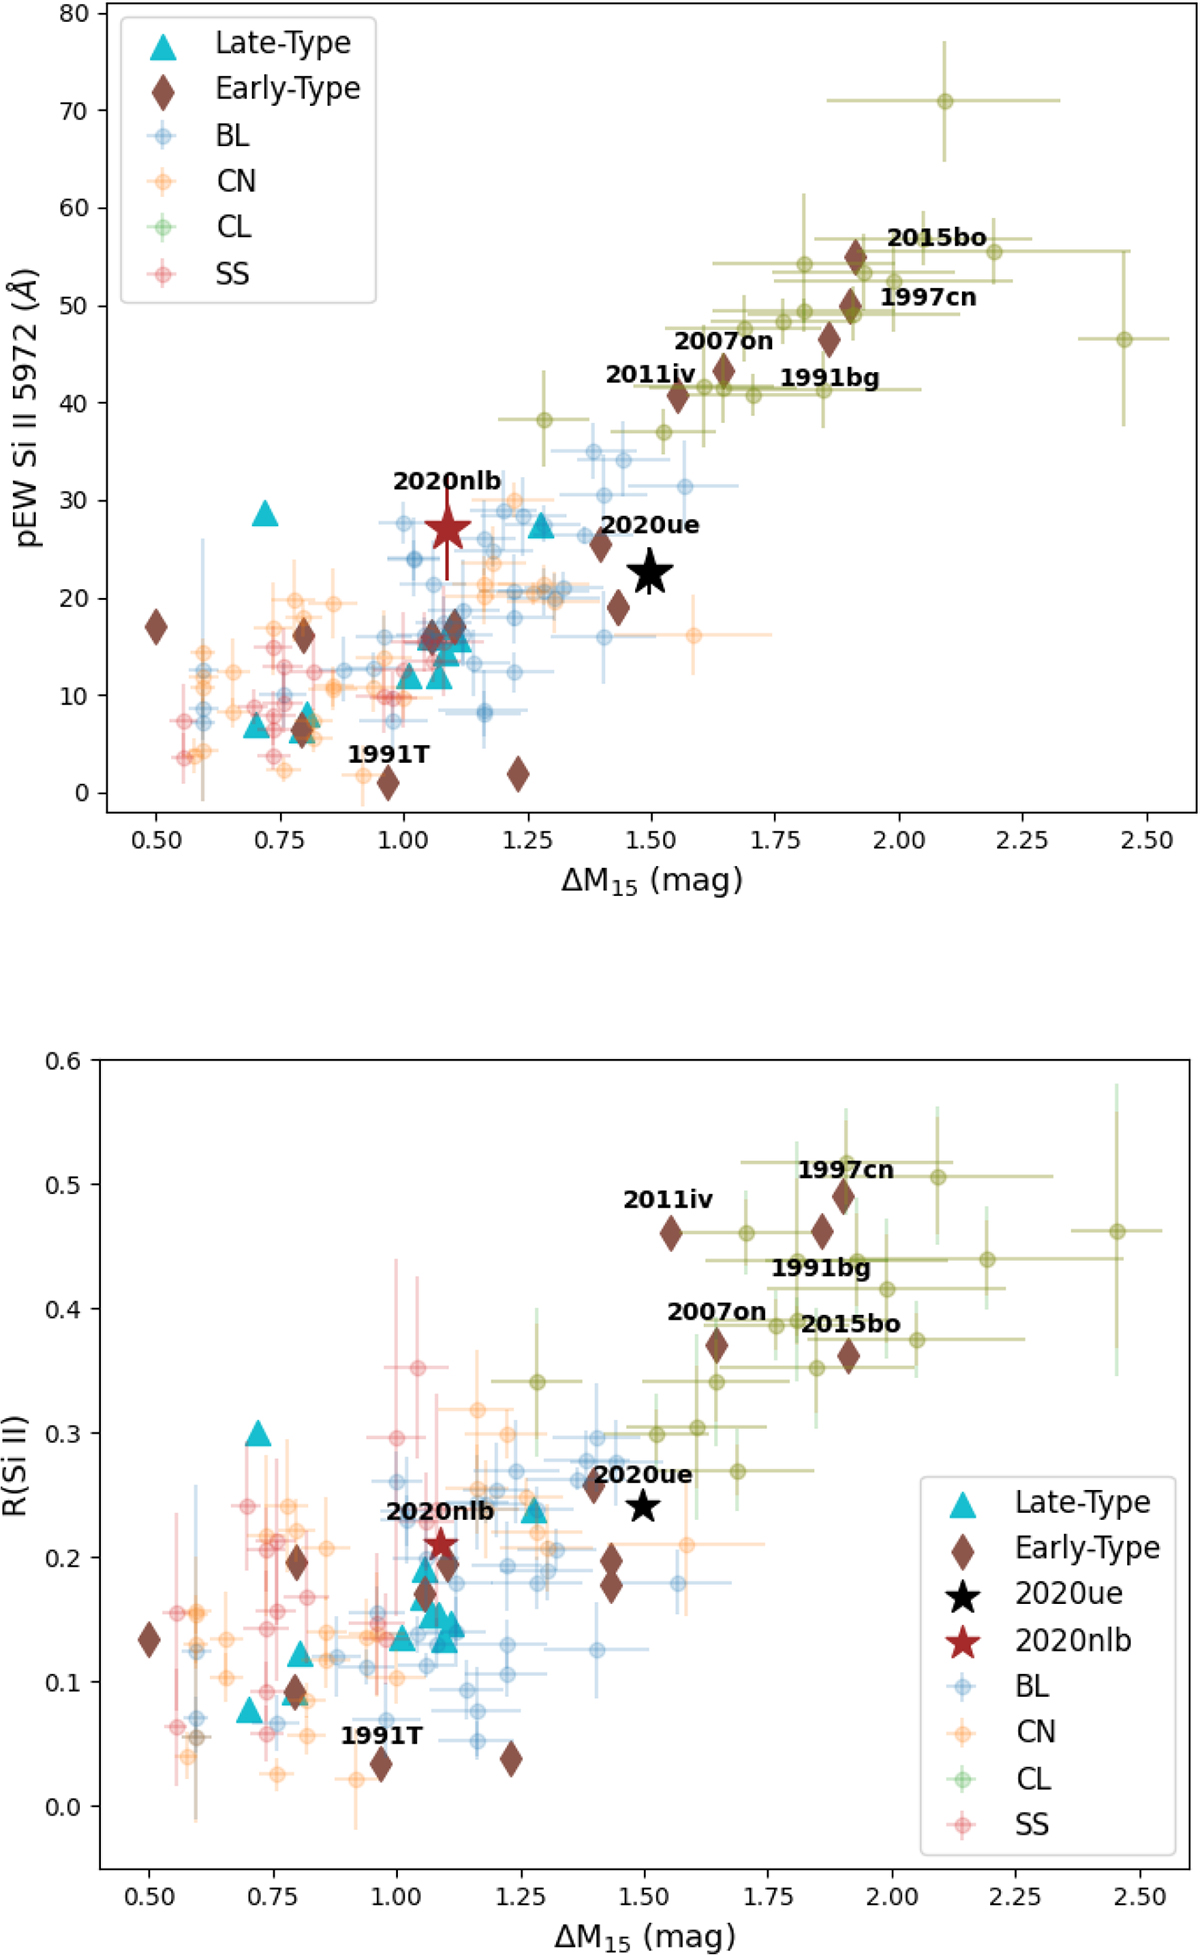
Fig. B.7.
Download original image
Same as Fig. 10, but with the distribution of the Δm15 parameter against the pEW of the Si II 5972 Å line (upper panel), and against the Si II ratio R(Si) (lower panel). Data shown in red, blue, green, and orange symbols are taken from Burrow et al. (2020) and respectively colour-coded according to the Branch spectroscopic sub-classes – SS, BL, CL, and CN. SN 2020ue and SN 2020nlb are highlighted as black and red stars, respectively.
Current usage metrics show cumulative count of Article Views (full-text article views including HTML views, PDF and ePub downloads, according to the available data) and Abstracts Views on Vision4Press platform.
Data correspond to usage on the plateform after 2015. The current usage metrics is available 48-96 hours after online publication and is updated daily on week days.
Initial download of the metrics may take a while.