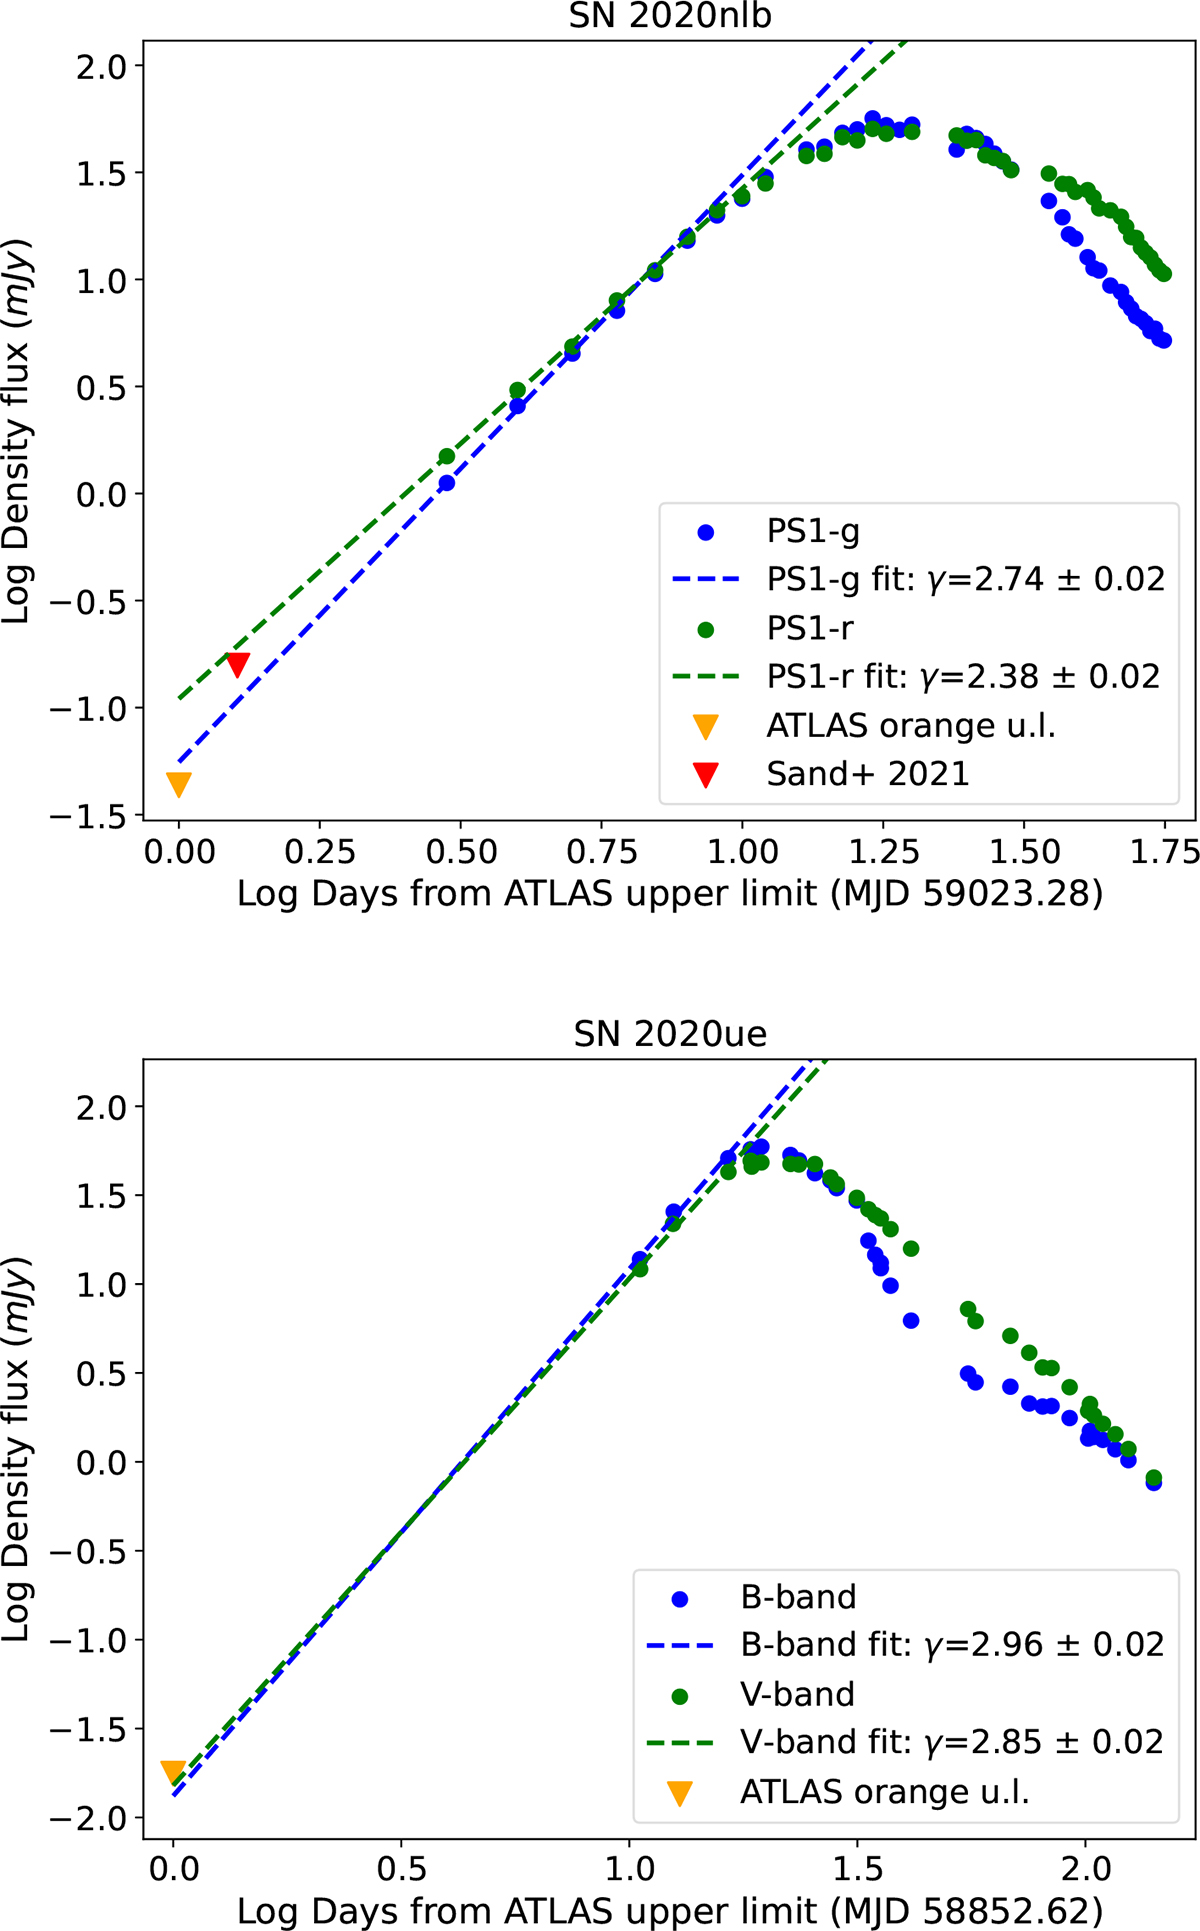
Fig. 6.
Download original image
Pan-STARRS g- and r- band light curves of SN 2020nlb (upper panel) and Copernico 1.82m B- and V-band SN 2020ue (lower panel), computed using the procedure outlined in Sect. 3.2. The dashed lines represent the best-fit obtained with a power-law model for the early light curve evolution (González-Gaitán et al. 2012). The most stringent ATLAS upper limit is indicated by an orange triangle, while an additional upper limit reported by Sand et al. (2021) 1.3 days later is marked by a red symbol at the time of the ATLAS observation. For SN 2020ue, the best-fit model extrapolation for the r band is consistent with these flux upper limits.
Current usage metrics show cumulative count of Article Views (full-text article views including HTML views, PDF and ePub downloads, according to the available data) and Abstracts Views on Vision4Press platform.
Data correspond to usage on the plateform after 2015. The current usage metrics is available 48-96 hours after online publication and is updated daily on week days.
Initial download of the metrics may take a while.