Fig. 7.
Download original image
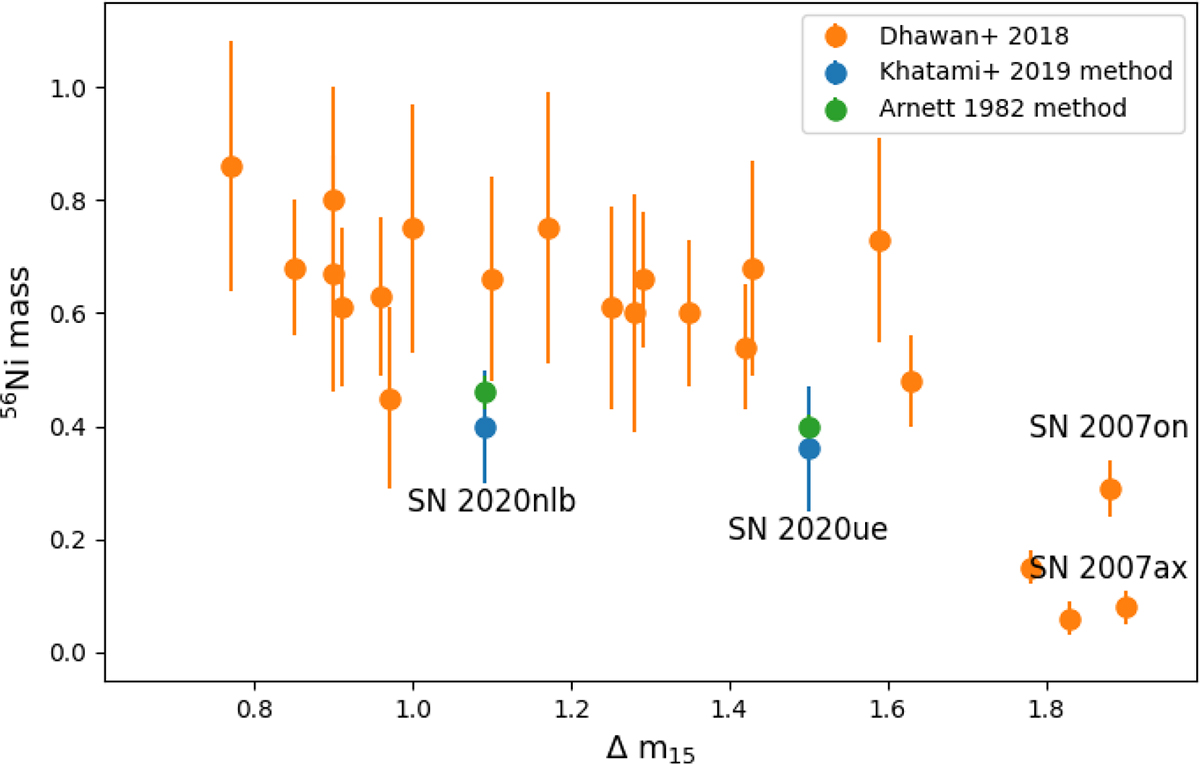
Distribution of 56Ni masses for SN 2020nlb and SN 2020ue as a function of Δm15 determined using both the Khatami & Kasen (2019) method (blue data) and the Arnett (1982) analytical model (green data). For comparison, we include the Arnett model results (orange data) for the SNe Ia sample from Dhawan et al. (2018). The locations of the transitional and fast-declining events SN 2007on (Gall et al. 2018) and SN 2007ax (Kasliwal et al. 2008) are highlighted.
Current usage metrics show cumulative count of Article Views (full-text article views including HTML views, PDF and ePub downloads, according to the available data) and Abstracts Views on Vision4Press platform.
Data correspond to usage on the plateform after 2015. The current usage metrics is available 48-96 hours after online publication and is updated daily on week days.
Initial download of the metrics may take a while.