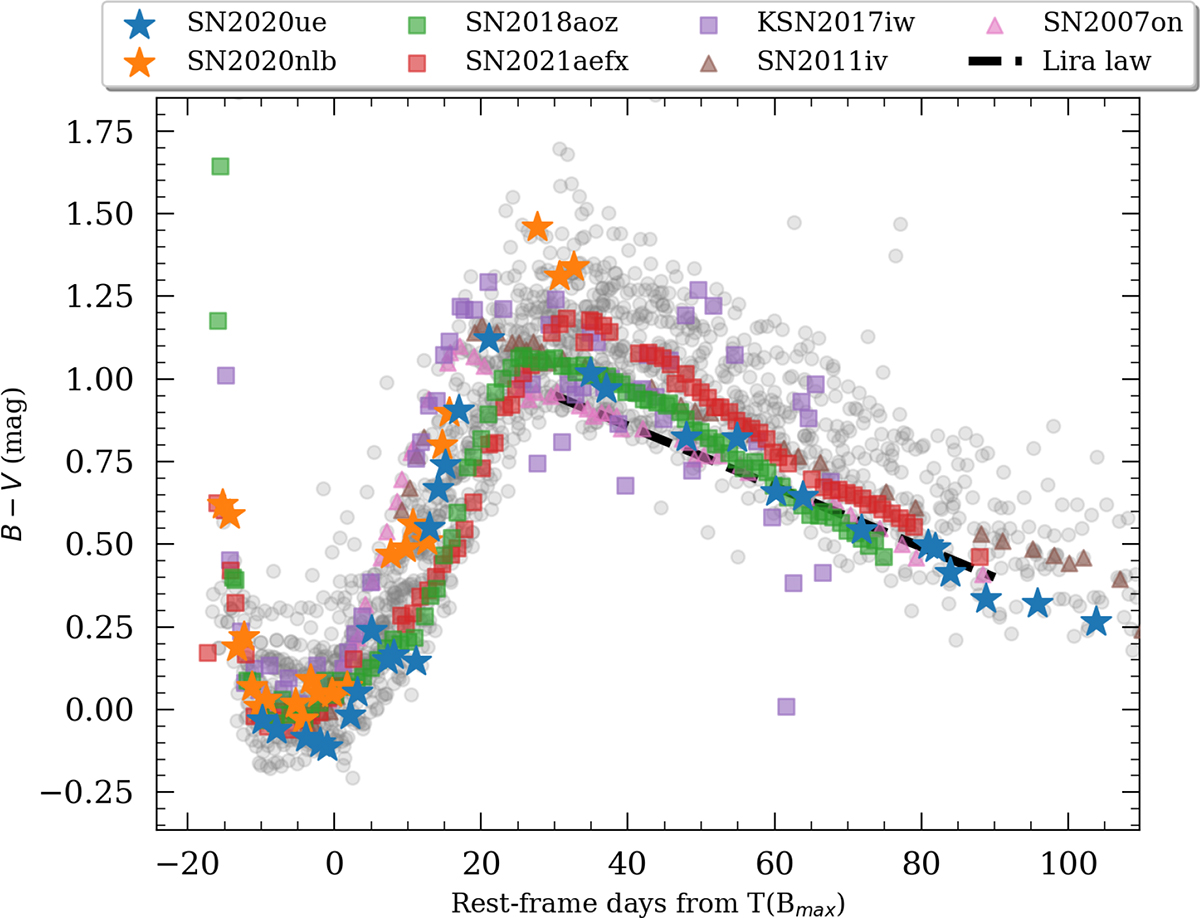
Fig. 8.
Download original image
Temporal (B − V) colour evolution, featuring SN 2020ue (blue stars) and SN 2020nlb (orange stars), along with a sample of nearby SNe Ia taken from Riess et al. (2016) and Khetan et al. (2021) (grey data), transitional SNe Ia (SN 2007on: Pink triangles; SN 2011iv: brown triangles, Gall et al. 2018), and early-time red SNe Ia (KSN 2017iw: violet squares; SN 2018aoz: green squares; SN 2021aefx: red squares, Ni et al. 2023b, 2025). The dashed black line indicates the Lira-law regime (Phillips et al. 1999).
Current usage metrics show cumulative count of Article Views (full-text article views including HTML views, PDF and ePub downloads, according to the available data) and Abstracts Views on Vision4Press platform.
Data correspond to usage on the plateform after 2015. The current usage metrics is available 48-96 hours after online publication and is updated daily on week days.
Initial download of the metrics may take a while.