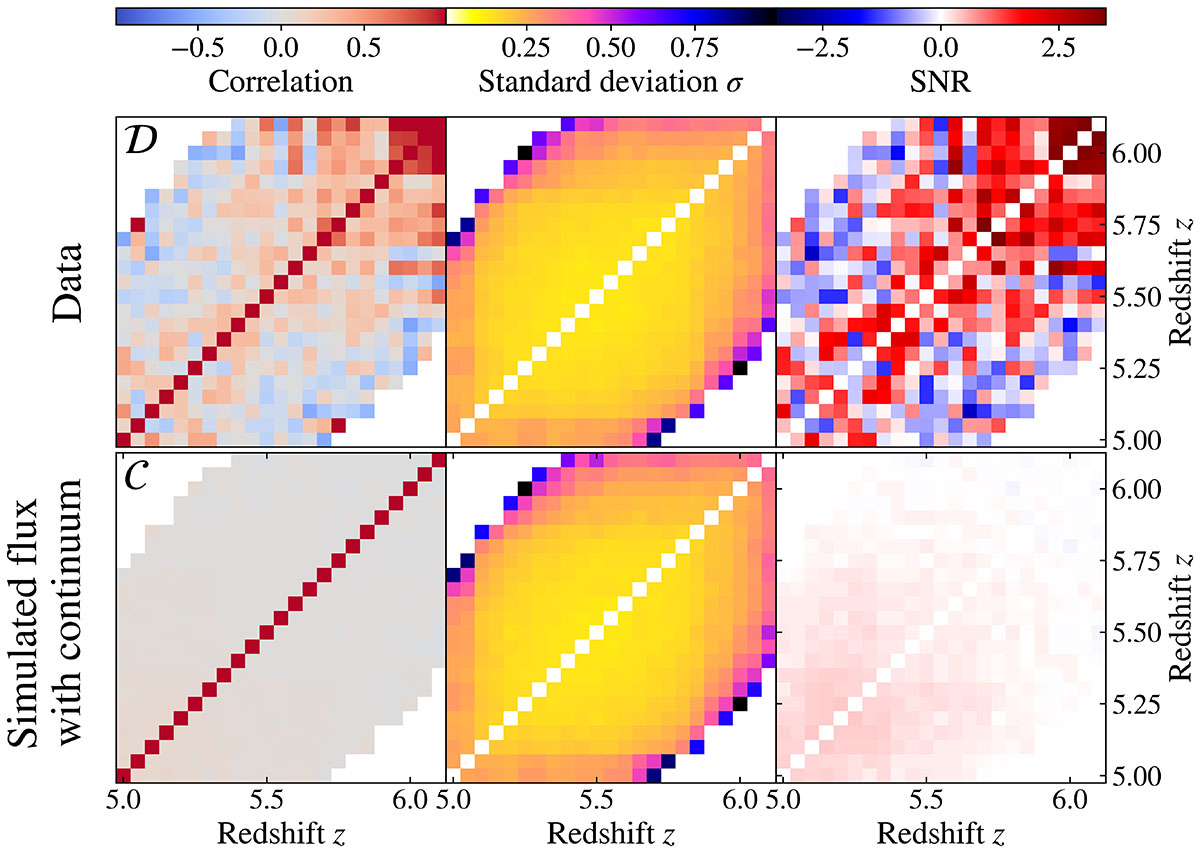
Fig. 1.
Download original image
Correlations in the Lyman-α forest flux across redshift. Top row: Correlation matrix for observed QSO sightlines, showing a positive correlation (in red) in the off-diagonal terms near the diagonal at all redshifts, and an increasing correlation length at higher redshifts. Bottom row: Mock sightlines with continuum-reconstruction uncertainties applied, leading to a slight increase in correlation at lower redshifts, while failing to account for the observed correlation at higher redshifts. First column: Correlation matrices. Second column: Standard deviation of the correlation matrices. Third column: Statistical significance of the correlation, estimated as the ratio between the correlation matrix and its standard deviation. The results suggest that while continuum-reconstruction uncertainties contribute to correlations at low redshifts, they cannot account for the correlations observed at higher redshifts.
Current usage metrics show cumulative count of Article Views (full-text article views including HTML views, PDF and ePub downloads, according to the available data) and Abstracts Views on Vision4Press platform.
Data correspond to usage on the plateform after 2015. The current usage metrics is available 48-96 hours after online publication and is updated daily on week days.
Initial download of the metrics may take a while.