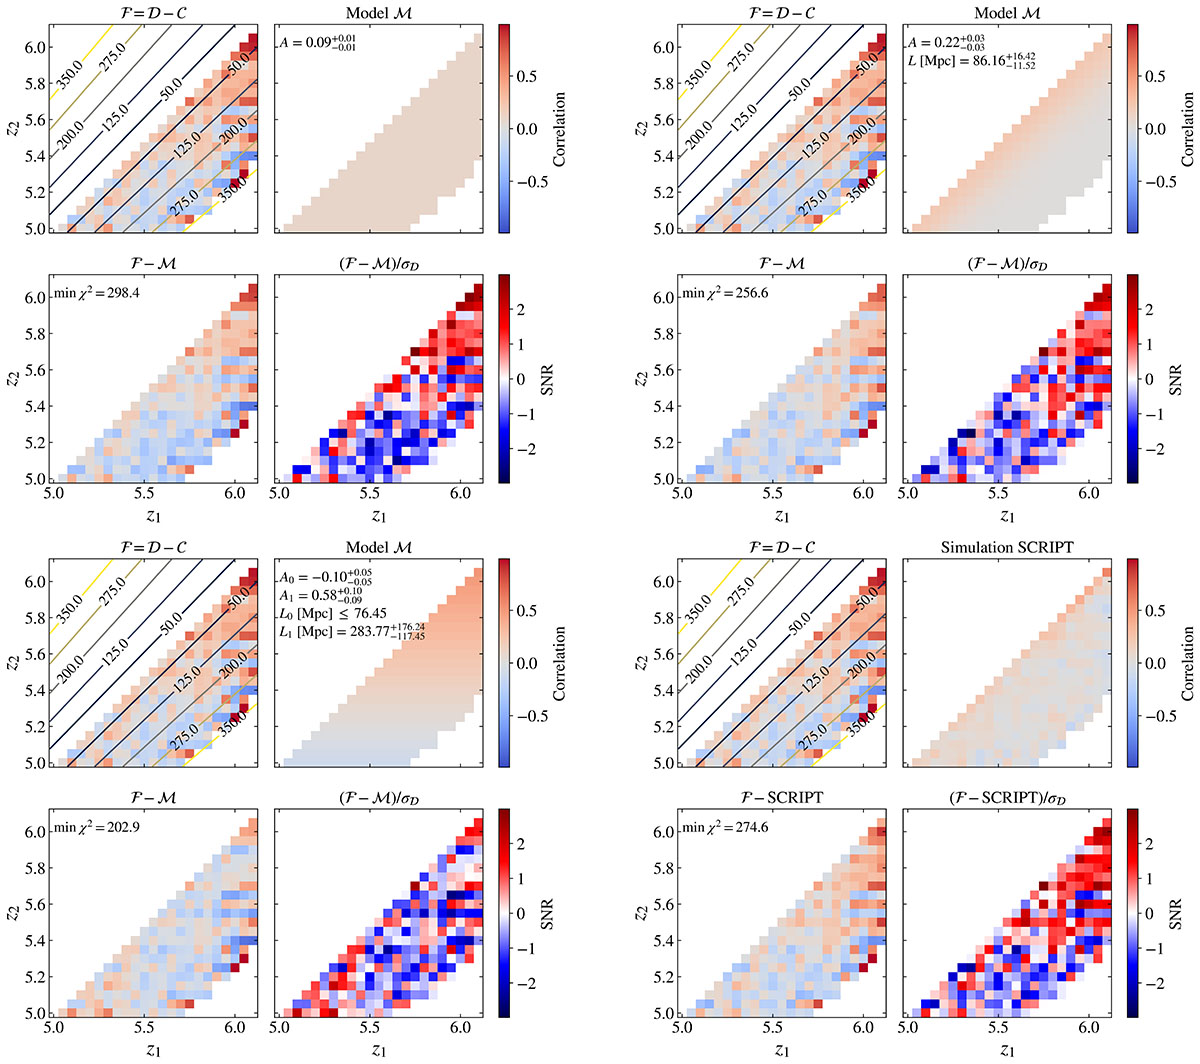
Fig. 2.
Download original image
Results of the fitting for different models. For each model, we show in the top left panel the correlation matrix used for the fitting, obtained by removing the effects from the continuum-reconstruction from the data; isocontours corresponding to the comoving distances in megaparsecs at each redshift pair are also shown. The top right panel displays results from the best fitting of the model considered here, ℳ. The residuals between the data and the best fit of the model, ℱ − ℳ, are shown in the bottom left panel. Finally, the bottom right panel shows the S/N of the data. Analogous panels for the simulations BIBORTON constλ and evolvλ are displayed in Figure E.3. Panel (a): Model ℳ1; constant. Panel (b): Model ℳ2; Gaussian, constant amplitude and width. Panel (c): Model ℳ3; Gaussian, amplitude and width redshift-dependent. Panel (d): BIBORTON SCRIPT.
Current usage metrics show cumulative count of Article Views (full-text article views including HTML views, PDF and ePub downloads, according to the available data) and Abstracts Views on Vision4Press platform.
Data correspond to usage on the plateform after 2015. The current usage metrics is available 48-96 hours after online publication and is updated daily on week days.
Initial download of the metrics may take a while.