Fig. 3.
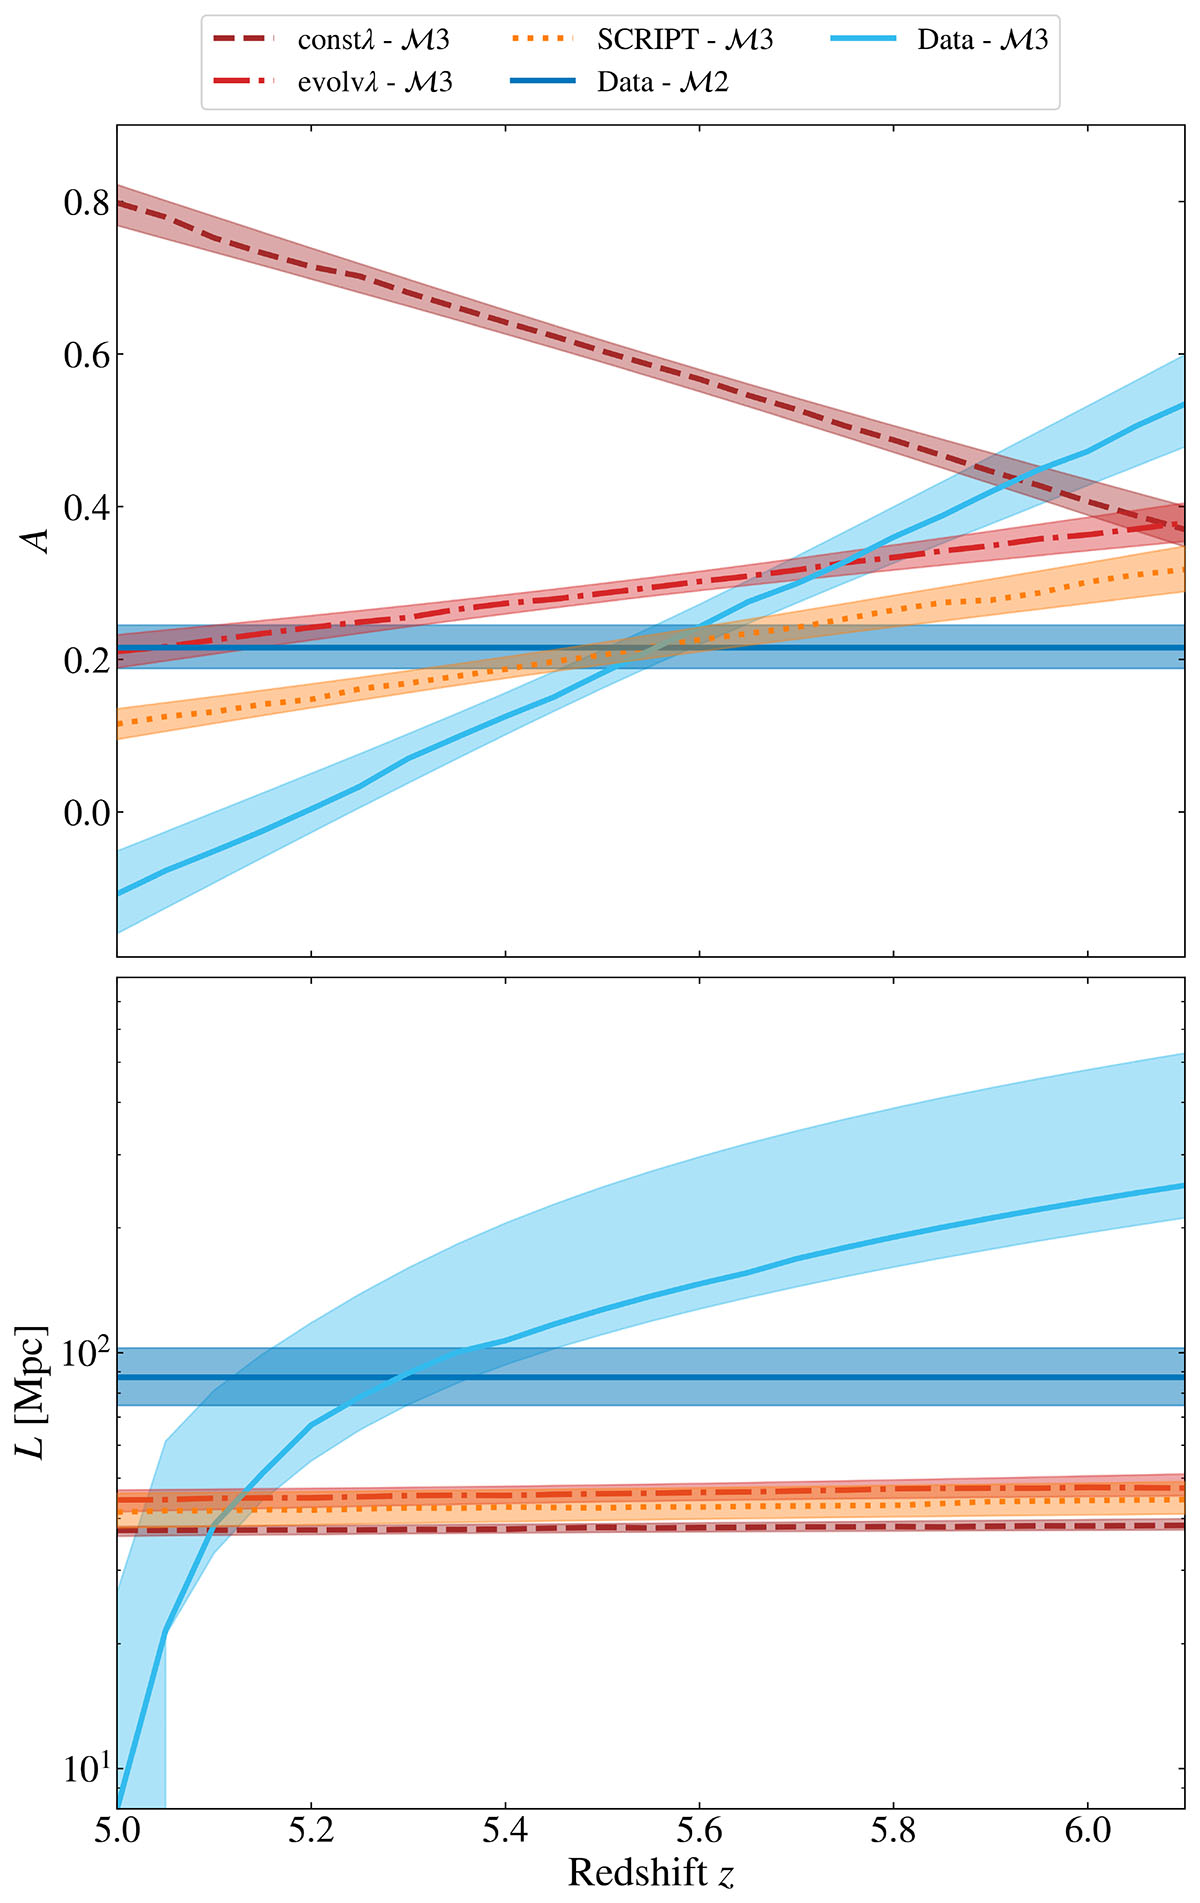
Download original image
Amplitude (top panel) and correlation length (bottom panel) as a function of redshift for different models and simulations. The continuous light blue (blue) lines are the results of fitting the observations with ℳ2 (ℳ3), a Gaussian model with constant (redshift-dependent) width and amplitude. The shaded regions represent the 1σ error on the A (L) parameters. The shaded blue region instead indicates the 16th and 84th percentiles of the A0-A1 (L0-L1) joint-posterior distribution, except for redshifts of z < 5.1, where only the 1σ upper limit of L is shown. The dashed brown, dash-dotted red, and dotted orange lines are the results of fitting the simulations (const λ, evolv λ, SCRIPT) with ℳ3.
Current usage metrics show cumulative count of Article Views (full-text article views including HTML views, PDF and ePub downloads, according to the available data) and Abstracts Views on Vision4Press platform.
Data correspond to usage on the plateform after 2015. The current usage metrics is available 48-96 hours after online publication and is updated daily on week days.
Initial download of the metrics may take a while.